Shadow Bid
The Shadow Bid is developed to provide an estimate of the annual service payment required by the private sector to pursue the project as a PPP. The ASP is the amount of revenue required to cover all expected costs, including an appropriate return to the private partner.
Figure 3 below shows that the Shadow Bid model, like the PSC, includes raw cost inputs like capital, operating, and life cycle costs. Rather than showing the private partner's cash flow to construct and maintain the project, however, the Shadow Bid shows the required ASP to the private partner, reflecting the cost to project owner over the life of the project agreement. Insurance premiums and taxes that are direct costs to the private sector are incorporated into the calculation of the ASP. In addition, risk is directly incorporated into the calculation of the ASP in the following ways:
● Contingencies for risk in design and construction sub-contracts,
● Contingencies for risk in operating subcontracts, and
● Financing rates:
(a) Lenders will assign a cost of debt to the project based on the profile of risks they are exposed to, and
(b) Equity investors will demand a return commensurate with the level of risk they are taking on in the project.
The contingencies include the expected value of the risks that the government expects to transfer to the private sector.
The top of Figure 3 shows the project cost inputs to the Shadow Bid model that are included in the solution for the required ASP. The line graph at the bottom of Figure 3 shows the resulting ASP: the output of the Shadow Bid model. This ASP is what the owner pays to the private sector partner for delivering the project according to the terms of the project agreement.
Figure 3: Shadow Bid Financial Model
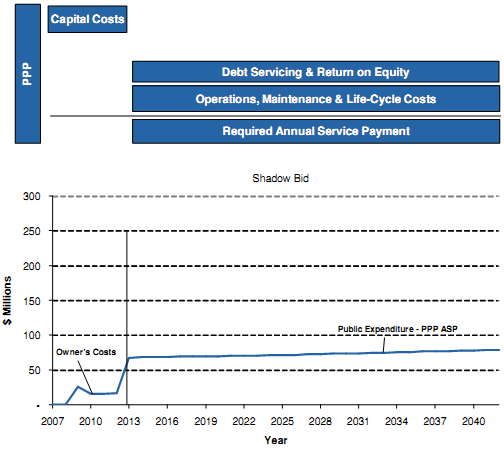
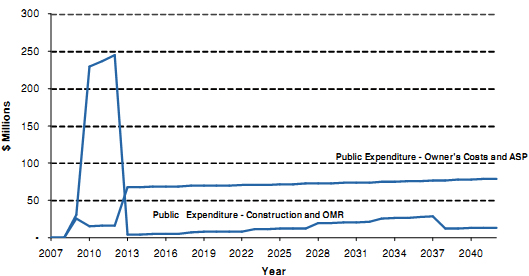
Figure 4 shows a direct comparison of the public sector payment stream alternatives, including public control of construction and OMR, with the associated risks, and a more predictable ASP stream for the Shadow Bid, with significant risks and associated uncertainty transferred to the private partner.
Figure 4: Public Sector Cash flow Streams - Direct Comparison