4.4 Optimism bias in the time dimension - statistical analysis
We noted that greater knowledge about the project can be expected to reduce time over-runs as the stages of the project progress. There are also several reasons why PPPs might be expected to take longer than Traditional procurement:
• First, by the Original Approval stage the milestone technical specifications are generally known for Traditional projects, while for PPP projects they are not yet known.
• Secondly, since PPPs involve Design and Construct (D&C) as well as subsequent maintenance and/or operation, including monitoring for quality etc., the contracting is bound to be more complex.
• Thirdly, the process by which PPPs obtain finance is more involved than for Traditional projects financed by governments.
With these caveats in mind, we turn to an examination of the raw data on time over-runs at each procurement stage in Table 4.3. Over the full period we found that the results were being skewed by one outlier PPP project (in the IT sector). After removing the effect of this outlier, we found that in a majority of stages, PPP projects were completed with less time over-run than Traditional projects. However, the differential between PPP and Traditional projects was not found to be statistically significant.
For the reasons outlined above, this result is highly positive to PPPs. Given that:
• Traditional procurement projects generally begin with a 'head start' over PPPs, since the technical specifications are generally known at the Original Approval; and
• PPP projects are subjected to additional scrutiny and interaction with governments and instrumentalities,
◀ Figure 4.1 Stage 3: traditional procurement cost over-run gap
______________________________________
Source: ACG/University of Melbourne
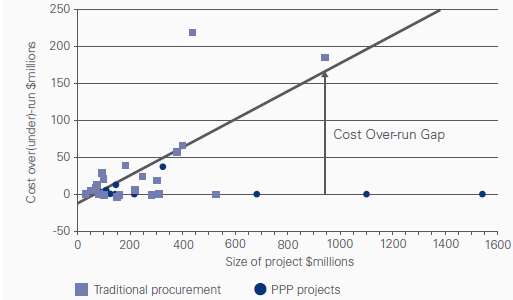
 Table 4.3
Time over-runs in traditional and PPP projects (%): raw data
Table 4.3
Time over-runs in traditional and PPP projects (%): raw data
____________________________________________
Source: ACG/University of Melbourne
| Full Period less outlier | Stage 1 | Stage 2 | Stage 3 | |
No. Obs. | 34 | 33 | 34 | 20 | 36 |
Traditional | 17.6% | 17.6% | 12.7% | 12.4% | 3.6% |
24.3% | 10.1% | 24.1% | 11.8% | 2.5% | |
Stat. Sig. | n.s. | n.s. | n.s. | n.s. | n.s. |
the fact that the PPPs in our sample were completed sooner (statistically no later) than Traditional projects is a very creditable result.
The raw data shown in Table 4.3, however, do not show the impact of timeliness of project completion when taking account of the size of projects. For example, there would be policy implications if Traditional projects were found to be timely when small, but relatively untimely in their completion when large. In Table 4.4 we have calculated an index of timeliness based on the final size of projects. That is, time over and under-runs are weighted by project size. Again, we find that in most of the stages, there is a timing advantage to PPPs.
In Stage 3, when the Traditional procurement contractor or PPP consortium have the most individual control over the time dimension of their project, we find that PPPs are completed ahead of (weighted) time by 3.4 percent, while Traditional projects are completed 23.5 percent behind time.