2. PPPs by country and over time
This section strives to give a better understanding of the evolution of PPPs across EU-countries, both by value and number of projects.
To start with, Table 1 shows the evolution of PPPs in the EU over time. Overall, more than 1300 PPP contracts have been signed in the EU from 1990 to 2009, representing a capital value of more than EUR 250 billion. This includes roughly 369 new projects with a value of almost EUR 70 billion having reached financial close since the beginning of 2007. Having steadily increased until the middle of this decade, both the number and value of the EU PPP market first stagnated and then started to decline.
Table 1. Evolution of European PPPs per annum
| Year | Number of | Value of projects |
| 1990 | 2 | 1386.6 |
| 1991 | 1 | 73.0 |
| 1992 | 3 | 610.0 |
| 1993 | 1 | 454.0 |
| 1994 | 3 | 1148.4 |
| 1995 | 12 | 3264.9 |
| 1996 | 26 | 8488.2 |
| 1997 | 33 | 5278.0 |
| 1998 | 66 | 19972.4 |
| 1999 | 77 | 9602.6 |
| 2000 | 97 | 15018.5 |
| 2001 | 79 | 13315.3 |
| 2002 | 82 | 17436.2 |
| 2003 | 90 | 17357.1 |
| 2004 | 125 | 16879.9 |
| 2005 | 130 | 26794.3 |
| 2006 | 144 | 27129.2 |
| 2007 | 136 | 29597.9 |
| 2008 | 115 | 24198.0 |
| 2009 | 118 | 15740.4 |
| Total | 1340 | 253744.9 |
Sources: EIB, HM Treasury, Irish PPP Unit and various commercial databases.
To gauge the importance of PPPs across EU-countries, Table 2 shows the share of each country in the number and value of projects closed in the EU during 1990-2009. For comparison we also present the numbers published in Blanc-Brude et al. (2007).5
Table 2. Countries' percentage shares of European PPPs, 1990-2009 aggregate
| % of No. of projects | % of value of projects | |||
| 2009 update | Blanc- Brude et al. (2007) | 2009 update | Blanc- Brude et al. (2007) | |
| AT BE BG CY CZ DE DK EL ES FI FR HU IE IT LV MA NL PL PT RO SE SK SI UK | 0.2 0.9 0.1 0.2 0.2 4.9 0.1 1.0 10.1 0.1 5.4 0.7 1.3 2.4 0.1 0.0 1.2 0.4 3.1 0.1 0.1 0.1 0.1 67.1 | 0.2 0.7
0.3 0.2 2.4 0.0 0.6 8.6 0.2 2.8 0.8 0.7 2.1 0.1 0.1 1.0 0.4 2.3 0.3 0.1 0.1 0.1 76.2 | 0.5 1.3 0.1 0.3 0.3 4.1 0.0 5.5 11.4 0.2 5.3 2.3 1.6 3.3 0.0 0.0 1.8 1.7 7.0 0.0 0.2 0.5 0.0 52.2 | 0.6 1.1
0.4 0.4 2.9 0.0 3.9 12.8 0.2 3.9 2.7 0.7 3.7 0.0 0.1 1.7 0.9 5.8 0.1 0.2 0.0 0.0 57.7 |
| Total | 100 | 100 | 100 | 100 |
Sources: Blanc-Brude et al. (2007), EIB, HM Treasury, Irish PPP Unit and various commercial databases.
During 1990-2009, the UK accounts for some two thirds of all European PPP projects, that is almost 10 percentage points less than in Blanc-Brude et al. (2007).6 With 10% of the total number of projects, Spain remains the second-biggest PPP market; and it has gained slightly in importance in recent years (9% in Blanc-Brude et al. (2007)). France, Germany, Italy, and Portugal all represent 2-5% of the total number of projects, respectively. The UK, Portugal, France, Germany, Spain and Italy together account for some 92% of all European PPPs by number; 3% less than in Blanc-Brude et al. (2007). Overall, this suggests that the PPP market in Europe continues to slowly diversify across countries.
The distribution in terms of project value over the past 20 years gives a similar picture. PPPs in the UK account for 53% of the total value of European PPPs (58% in Blanc-Brude et al. (2007)). PPP market share in Spain by value is even larger than by number of projects. Portugal is the third largest PPP market by value - and has become more important in recent years. This reflects mainly the completion of some large road projects such as the Douro Litoral Toll Road or the Transmontana Highway in recent years. France, Germany and Greece together represent about 15% of the value of PPPs in Europe (11% in Blanc-Brude et al. (2007)). The PPP market in Hungary remains the largest one among New Member States (NMS).
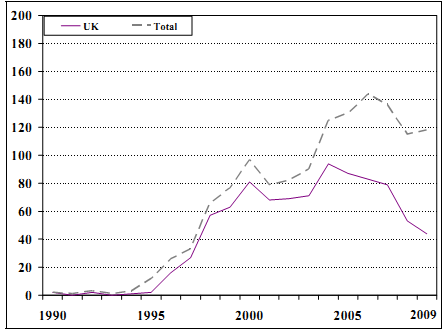
To assess the evolution of the relative size of the PPP market in the UK over time, Figure 1 shows the total number of deals per annum for the UK and the EU as a whole since 1990. The number of PPPs in the UK increased rapidly from the mid 1990s onwards, reaching its peak in 2004. For the EU as a whole, the number of projects continued to increase until 2006. The share of UK projects in the EU started to decline in 2001. During the recent financial crisis, this trend accelerated with the UK market share in the annual number of EU projects falling below 50% in 2008. This highlights once more the ongoing diversification of PPPs across countries.
Sources: EIB, HM Treasury, Irish PPP Unit and various commercial databases. Note: The total figure includes the UK.
Figure 1. Number of deals reaching financial close per year
________________________________________________________________________________________________
5 Note that their numbers include all PPP projects signed by end of 2006. The 2009 update includes all projects having reached financial close by the end of 2009.
6 The latest data published by HM Treasury in September 2009 lists 661 projects (see http://www.hmtreasury.gov.uk/documents/public_private_partnerships/ppp_pfi_stats.cfm). However, they state that this list omits many deals previously reported by Ministries, due to them being either completed, consolidated or smaller than the revised recommended threshold of EUR 30 million euro. In contrast, our database also includes deals that are smaller than EUR 30 million.