3. PPPs by sector
This section concentrates on the distribution of PPPs across economic sectors.7 Given the differences in the maturity and sectoral structure across national PPP markets, data are reported separately for the UK and continental Europe.
Starting with the UK, Figure 2 shows the sectoral distribution of its PPPs by number (top panel) and by value (bottom panel). By number, PPPs in education (35% of total) and health (34%) are most important in the UK and kept growing. The number of PPPs in general public services is large as well (14%), but remained fairly stable. In contrast, transportation has fallen to only 4% of the number of PPPs. Also the number of projects in defence and public order and safety declined over time.
The bottom panel shows that the relative importance of transport PPPs in the UK also decreased by value. The share of transport PPPs by value (17% of total) remains more important than by number. Having said this, its value share has fallen behind education (27%) and health (25%). The figure also shows that the value of PPPs in defence increased. With the number of defence PPPs declining, this suggests a notable increase in the size of defence projects (see also Figure 5).
Figure 2. Number (top panel) and value (bottom panel) of PPPs in the UK by sector, in % of total , 5 year averages
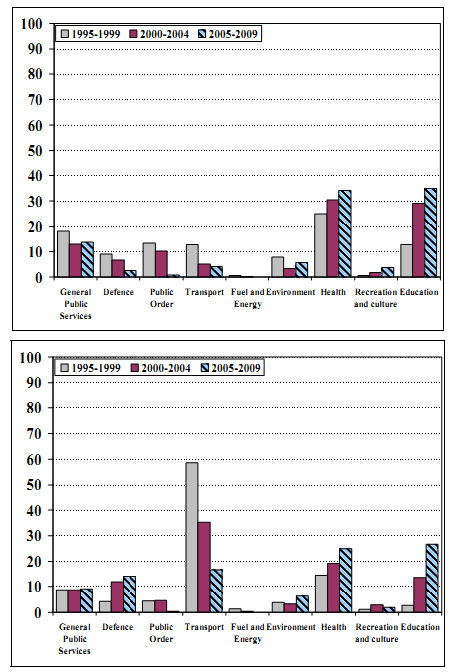
Sources: EIB, HM Treasury, Irish PPP Unit and various commercial databases.
As shown in Figure 3, the sectoral distribution outside the UK remains concentrated in transport, but gradually diversifies. Over the past 5 years, the transport sector represented 41% of the number and 76% of the value of PPPs in continental Europe. Education and health PPPs are gaining ground, but remain less significant than in the UK. Together they constitute 26% of the number and 11% of the value of PPPs in continental Europe in 2005-09 (in the UK 69% and 51%, respectively). The importance of the environmental sector in PPPs decreased over time, particularly by number.
Figure 3. Number (top panel) and value (bottom panel) of PPPs outside the UK by sector, in % of total, 5 year averages
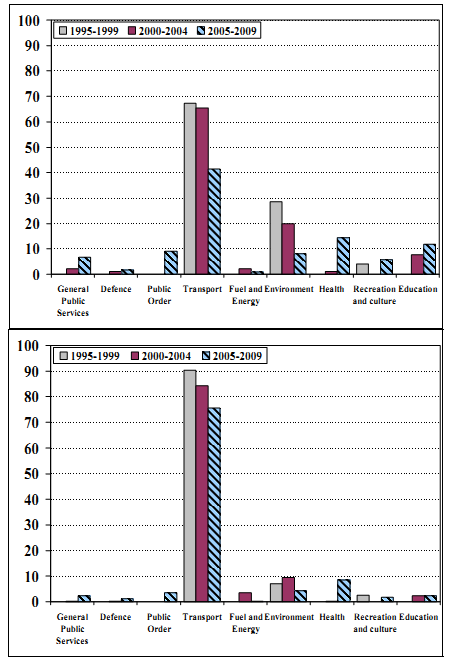
Sources: EIB, HM Treasury, Irish PPP Unit and various commercial databases.
For a finer breakdown, Figure 4 shows the composition of transport PPPs in continental Europe by various sub-sectors. Outside the UK roads remain by far the dominant component of transport PPPs representing more than two thirds of its total number and value. The importance of urban railway increased; the importance of bridges, tunnels and airports decreased.
Figure 4. Number (top panel) and value (bottom panel) of transport PPPs outside the UK by sub-sector, in % of total, 5 year averages
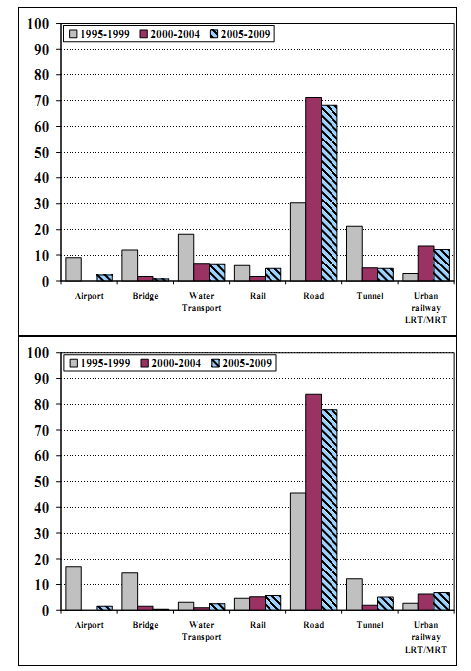
Sources: EIB, HM Treasury, Irish PPP Unit and various commercial databases.
The discussion so far suggests that notable discrepancies exist in the relative number and value of PPPs across sectors. What does this imply for the typical size of PPP projects in different sectors? Figure 5 shows the evolution of median project values of PPPs in the UK (top panel) and continental Europe (bottom panel) for different sectors and time periods.
Figure 5. Median size of PPP projects in the UK (top panel) and the EU (excluding the UK, bottom panel) in € millions by sector
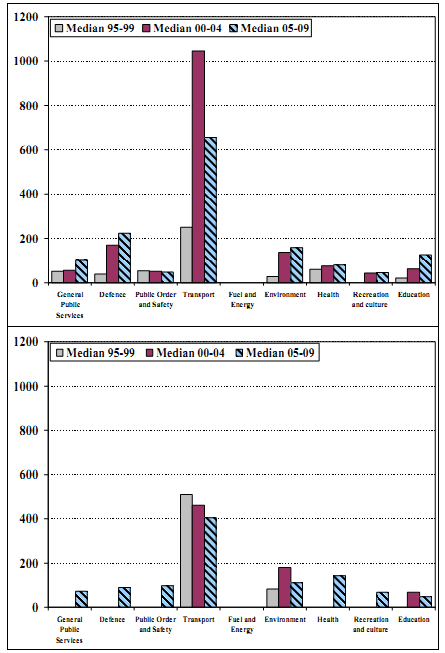
Sources: EIB, HM Treasury, Irish PPP Unit and various commercial databases.
In the UK (top panel), PPP projects in the transport sector are typically by far bigger than in other sectors. The recent decline in the size of transport PPPs may be due to some large PPPs related to the London underground at the beginning of this decade. In most other sectors, with the exception of transport and public order, the typical project size has increased over time. The guidance by HM Treasury (2006) to favour larger projects (above EUR 30 million)8 is one reason for this trend.
In continental Europe (bottom panel), the median size of PPPs is smaller than in the UK for most sectors (the main exception being health). Also outside the UK, transport PPPs tend to be bigger than PPPs in other sectors, though their size decreased in recent years. The figure also highlights that, apart from transport and environment, PPPs in most sectors emerged only recently in continental Europe.
________________________________________________________________________________________________
7 The sector specification used in this paper deviates slightly from the one used in Blanc-Brude et al. (2007). As in the 2007 paper, each project is characterized by one sector and one sub-sector. The 2009 update tries to stick as closely as possible to the Classification of the Functions of Government (COFOG) as defined by the United Nations. The sector specification used here distinguishes among 9 functions of government and 27 sub-sectors based on the more detailed COFOG breakdown. Both sectors and sub-sectors used in this paper have been selected and if needed re-specified to match our sample of PPP projects. To limit the number of sub-sectors, we deviate from COFOG in so far as projects characterised by a certain sub-sector may be assigned to different sectors. For instance, while both a military barrack and a student hostel fall under accommodation (sub-sector), the former is assigned to defence(sector) and the latter to education (sector).