4. Macroeconomic significance of PPPs
So far the focus has been on the evolution of the number and value of PPP projects in the EU across countries and sectors. This says only indirectly something about the macroeconomic significance of PPPs. To better understand their relevance, it is useful to compare the value of PPPs to total government investment because this is the best comparator that is available.
There are some important caveats in order. First, a comparison of stock (PPP projects) and flow variables (government investment) is, obviously, a comparison of apples with oranges. Furthermore, the capital expenditure of those PPPs that are recorded on the governments' balance sheets is also included in the government investment figures; consequently, without such inclusion, the government investment figures shown would be smaller and hence the relative size of PPPs bigger.
We can however make our capital value data better comparable to investment flows by spreading the value of each PPP project over five years (the year of the financial close and the 4 subsequent years). As in Blanc-Brude (2007), we consider the 5 years period to roughly represent the duration of a typical major works contract.9
Figure 6 shows the estimated aggregate value of PPP investment flows and government investment by country, both expressed in percent of GDP. To capture changes over time, five year averages are presented (1995-99, 2000-04 and 2005-09, respectively).
Only for the UK actual PPP investment flow numbers are publicly available. To see the difference between our own estimates of PPP investment flows (UK/1) and the numbers published by HMT (UK/2), we present both numbers. There are two reasons why PPP investment flows published by HMT differ from our own data. First our definition of PPPs does not exactly correspond to the definition of PPPs by HMT. Second, our way of estimating investment flows through spreading the value of projects of five years is imprecise. Though our own data (UK/1) point towards a slightly higher macroeconomic significance than the HMT data (UK/2) do, our estimates seem to be reasonable.
In all countries PPP investment flows represent less than one percent of GDP. Figure 6 suggests that PPPs are of macroeconomic significance only in Greece, Portugal, the UK and, to some extent, Spain and Ireland. Greece is in fact characterised by a small number of large PPP projects. The countries with the largest increase of PPPs relative to GDP over the past five years are Ireland, Spain, the UK and, in relative terms, France, Germany and Italy.
Figure 6. Government investment and PPPs (averages 1995-1999, 2000-2004 and 2005-2009, in percent of GDP)
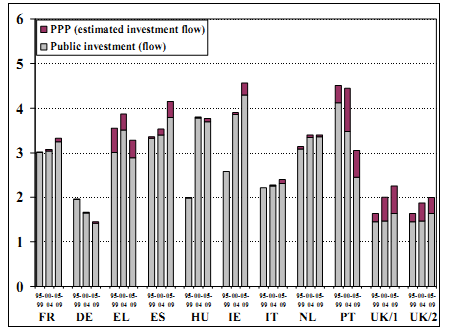
Sources: EIB, HM Treasury, Irish PPP Unit, Eurostat and various commercial databases.
Note: UK/1 shows our own estimates of PPP investment flows in the UK consistent with the numbers reported for all other countries. UK/2 refers to PPP investment flow data published by HMT.
To gauge the significance of PPPs at a sectoral level, we next compare it to total investment for three key sectors-namely transport, education, and health.
Starting with the transportation sector, Figure 7 depicts estimated investment flows of transportation PPPs relative to total investment in transport, storage and communication for 1995-99, 2000-04 and 2005-07 (non UK 2005-08). Once more PPP investment flows are estimated by spreading the capital value of PPPs over five years (see also Figure 6). As in Blanc-Brude et al. (2007) the inclusion of storage and communication in the denominator is problematic as this tends to underestimate the importance of PPPs in the transport sector.
Figure 7. Estimated PPP investment flows in transport relative to total investment in transport, storage and communication (in percent)
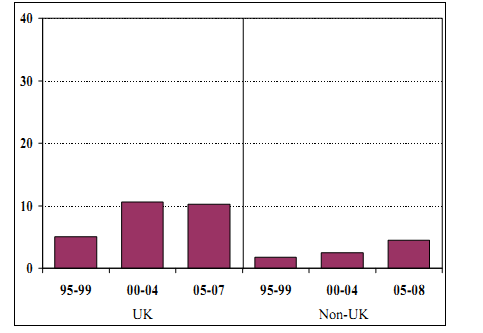
Sources: Sources: EIB, Irish PPP Unit, various commercial databases, Eurostat, EU-Klems (for UK sectoral investment 2005-2007).
Note: BG and RO are not included in the Non-UK sample. Sectoral investment data for GR and EE only go back to 2000.
Figure 7 suggests that in the UK PPPs represent about 10% of total investment in the transport sector. In contrast, transport PPPs in continental Europe play a smaller role but caught up and reached about 5% in 2005-08.
A similar comparison for the education sector is shown in Figure 8. The numbers in this figure are more precise than the ones for transport, as the denominator (total economy investment in education) is directly comparable with the nominator (estimated investment flows of PPPs in education). Again, PPPs are of significance in the UK, with their relative importance increasing from about 1% in the period 1995-99 to almost 20% in the period 2005-09. PPPs in education have emerged in continental Europe only recently, and their relevance remains small.
Figure 8. Estimated PPP investment flows in education relative to total investment in education (in percent)
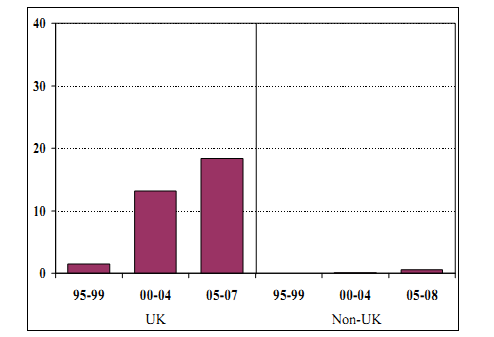
Sources: Sources: EIB, Irish PPP Unit, various commercial databases, Eurostat, EU-Klems (for UK sectoral investment 2005-2007).
Note: BG and RO are not included in the Non-UK sample. Sectoral investment data for GR and EE only go back to 2000.
Figure 9 shows that in the health sector PPPs are also a significant source of investment in the UK. Starting from about 5% during the period 1990-94, PPPs represented almost 40% of total investment in health in the period 2005-07. With only about 1% of total sector investment, PPPs in health are so far of limited significance outside the UK.
Figure 9. Estimated PPP investment flows in health and social work relative to total investment in health and social work (in percent)
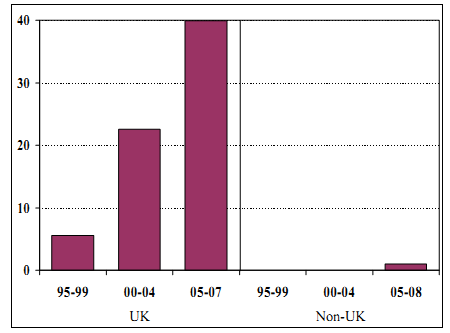
Sources: Sources: EIB, Irish PPP Unit, various commercial databases, Eurostat, EU-Klems (for UK sectoral investment 2005-2007).
Note: BG and RO are not included in the Non-UK sample. Sectoral investment data for GR and EE only go back until 2000.
________________________________________________________________________________________________
8 The initiative aimed at bundling individual projects to achieve a minimum size of 30 million euro in order to minimize fixed transaction costs (by project).
9 The 5 year period is suggested by EIB project experts, though the actual investment period may vary considerably across sectors.