5. PPPs and the recent financial crisis
This section takes a closer look at the evolution of PPPs during the financial crisis that began in 2007. The purpose of this section - as throughout the paper - is to provide a descriptive assessment of the evolution of PPPs in Europe rather than explaining why these changes happened.
Table 1 showed that PPPs in Europe increased substantially before 2008 but since then declined considerably. The notable decline in the number and value of deals in 2008 and 2009 implied a return to levels observed well before their peak in 2006/07. Indeed, the number of PPPs in 2008 and 2009 was similar to the one observed in 2004. The decline in the value of deals during the financial crisis was stronger; while sustained in 2008, the value of PPP projects closed in 2009 was close to 2000 levels.10
To get a more detailed picture of the evolution of PPPs during the financial crisis, Figure 10 shows the number and value of PPPs on a quarterly basis for the EU.
Figure 10. Evolution of PPPs by value (bars, in € millions left-hand axis) and number (line, right-hand axis) of deals, quarterly breakdown
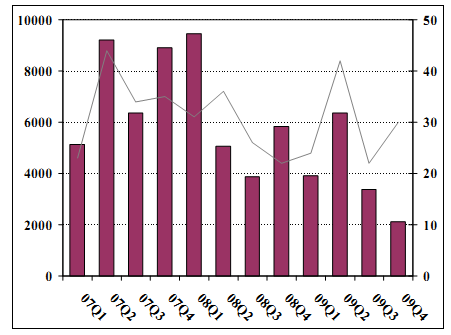
Sources: EIB, EPEC, various commercial databases.
The value of PPPs reaching financial close has gradually declined since the first quarter of 2008, reaching its lowest point in the last quarter of 2009 (a total value of EUR 2 billion). On average, the value of PPPs in 2009 was 50% below where it stood in 2007.
__________________________________________________________________________________________________
1 0 Note that the 2008 total figure may be distorted - as will be the sectoral distribution graph - by the major £2.6 billion UK defence Strategic Air Tanker deal (FSTA), which alone accounts for over 15% of the 2008 figure. The closest comparable project in 2009 is the £ 1.3 billion M25 Road PPP.