PPPs by country
The evolution of PPPs in aggregate terms may hide important variation across countries. To elaborate more on this issue, Figure 12 shows the number and value of closed PPP deals across countries in recent years.
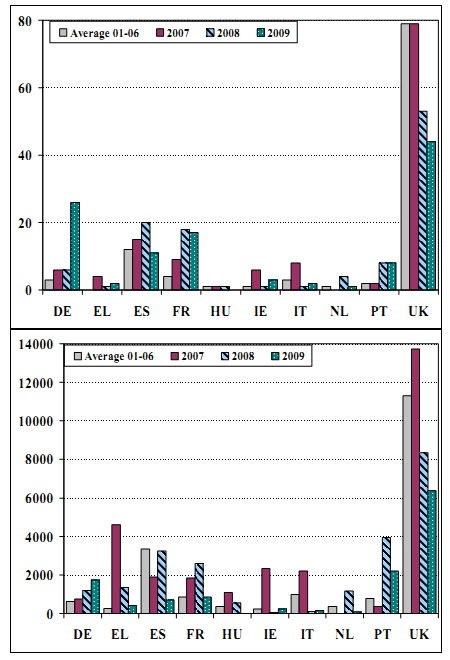
Figure 12. Evolution of number (top panel) and value (bottom panel, in € millions) of closed PPP deals by country
Sources: EIB, HM Treasury, Irish PPP Unit, various commercial databases.
As discussed in Section 2, the PPP market continued to diversify across countries during the financial crisis. The number of PPPs in the UK almost halved, as did its value. Also in Spain, the second largest PPP market in Europe, the value of PPPs declined in recent years. At the same time, there is a number of emerging PPP markets that gained momentum. In Germany, France and Portugal the number of deals increased notably in recent years. In Germany and Portugal, PPPs also increased in value terms.
Overall, the diversification of PPPs across countries continued during the financial crisis: While mature PPP markets such as the UK and Spain have slowed down, emerging PPP markets such as Germany, Portugal and, to some extent, France have gained momentum. The UK share is diminishing, as the PPP concept is taking root in these countries. Indeed, during the period 2001-2006, PPP transactions reaching financial close in the UK represented 75% of the EU total value on average. In contrast, the UK accounted for 30% of all European PPPs in 2008 and 2009. The 44 projects reaching financial close in 2009 in the UK represented the lowest number since 1997, and just over half of the 85 a year on average between 2004 and 2007.