Capability performance to date of MPR projects
2.30 While a multi-year comparison of capability performance needs to be treated with caution due to year-to-year changes in the basis of the data52, this third MPR provides the opportunity to start to examine broad trends in the DMO's assessment of the likelihood of projects delivering the required capabilities over time. This comparison can be done through examining this year's PDSSs and data reported by the DMO in its part of the MPRs for 2007-08 and 2008-09.53
2.31 Figure 10 examines the DMO's assessment about the likely delivery of the MOEs for the nine Major Projects in the first MPR (2007-08 MPR); 14 of the 15 Major Projects in the second MPR (2008-09 MPR); and the 21 Major Projects including MOEs in this year's PDSSs. The DMO's data suggests that increasingly, a greater proportion of key performance measures are considered likely to be met for the portfolio of projects covered by the MPR.
Figure 10
Projects' Measures of Effectiveness: DMO Level of Confidence in their Delivery in 2008, 2009 and 2010 (Percentages: Green, Amber and Red)
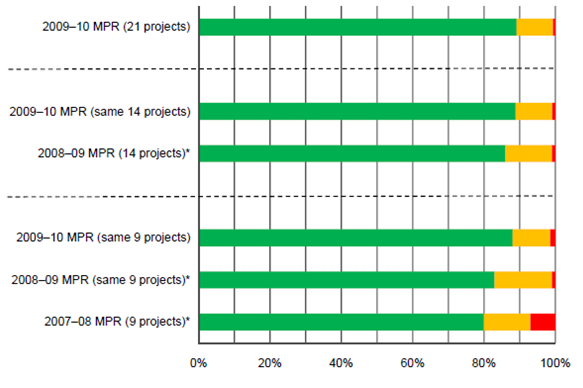
Sources: 2007-08 MPR, 2008-09 MPR and 2009-10 MPR.
Note 1: MOEs concern the forecasting of future achievements and are outside the scope of ANAO's review.
Note 2: It should be noted that what are defined as a project's MOEs can change from year-to-year. Therefore, any comparison of an individual or a group of projects' MOE data across years should be treated with caution as this may not involve comparing 'like with like'.
Note 3: *The ANAO did not examine the accuracy of the recording of this data in previous MPRs.
________________________________________________________________________
52 The definitions of a project's MOEs can change from year-to-year. Therefore, any comparison of an individual or a group of projects' data across years should be treated with caution as this may not involve comparing 'like with like'.
53 Previous years' MOE data was not included in the PDSS to enable ANAO to examine this data.