4.1 Cost Performance
Cost performance results are presented as Tables 5 to 7 below.
Table 5 Cost over-runs: Traditional and PPP projects relative to anticipated cost at the start of the period under consideration (based on averages) (source: Duffield 2008)
| Full period | Stage 1 | Stage 2 | Stage 3 | |
| No of observations | 40 | 45 | 43 | 40 |
| 52.0% | 38.2% | 19.7% | 18.0% | |
| PPP projects | 23.8% | 22.2% | 7.8% | 4.3% |
| Difference (Traditional - PPP) | 28.2% | 16.0% | 11.9% | 13.7% |
The results in Table 5 demonstrate that PPPs perform better than Traditional projects for each time period investigated. The difference in performance was 28.2% for the full period.
The average results as presented as in Table 5 are comparable with Mott MacDonald results for Stage 2 and those of Allen et al report presented in Table 1.
The use of averages in a relatively small sample may lead to extraneous results if there is a wide variation in the extreme values in the sample. This is the case for this data set, particularly for Traditional projects, where there are a few projects that have performed poorly. These poorly performing projects influence the average and thus may skew the interpretation of what happens more generally. A graphical representation of one of the outputs, detailing specific project outcomes and variation, is provided as Figure 2.
Full Period-Normalised Original Announced Cost to Actual vs. Project Size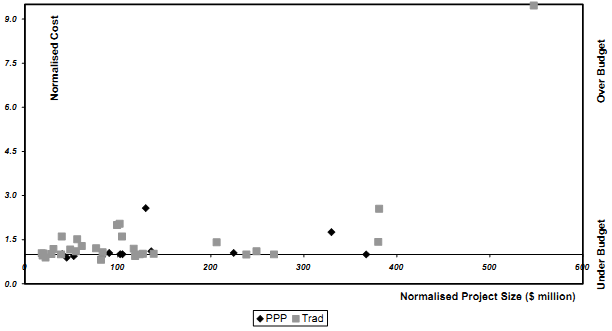
Figure 2: Full period: Normalised cost results: Original announced cost to actual final cost
(source: Duffield 2008)
To overcome the limitations with averages, use of median values are appropriate as individual results do not skew the outcome. The median (sometimes called the P50 value) provides a balanced outcome of what is to be expected. The range of outcomes between P25 and P75 (termed the inter-quartile range) provides an indicator of the likely variance in the predicted outcome; the use of P25 and P75 provides every opportunity to avoid extreme outcomes and provides a 50% confidence in the results. The lower the variance the more likely it is to achieve the median result. These indicators are presented for cost as Table 6.
| Table 6 Cost over-runs: Traditional and PPP projects relative to anticipated cost at the start of the period under consideration (based on median results) (source: Duffield 2008) | ||||
| Full period | Stage 1 | Stage 2 | Stage 3 | |
| No of observations | 40 | 45 | 43 | 40 |
| Traditional projects: Median (P50) | 10.1% | 5.6% | 4.0% | 3.6% |
| PPP projects: Median (P50) | 0.7% | 0.3% | 2.6% | 0.0% |
| Difference in medians (Traditional - PPP) | 9.4% | 5.3% | 1.4% | 3.6% |
| Inter-quartile range for Traditional projects (i.e. P75 - P25) | 41.6% | 31.1% | 28.3% | 17.4% |
| Inter-quartile range for PPP projects (i.e. P75 - P25) | 10.1% | 18.5% | 21.3% | 1.4% |
| Difference in Inter-quartile range (Traditional - PPP) | 31.5% | 12.6% | 7.0% | 16.0% |
The results as presented in Table 6 again indicate that PPPs perform better than Traditional projects for each time period investigated. The difference in performance was 31.5% for the inter-quartile range over the full period.
To facilitate comparison of the findings of this study with those from the NAO study [4] results have also been produced based on the number of projects achieving the expected outcome. A zone of acceptability of ± 5% has been applied to the stated expected outcome for this purpose. The results of this approach for cost are detailed in Table 7 below.
Table 7 Cost over-runs: Traditional and PPP projects relative to anticipated cost at the start of the period under consideration (based on number of projects >5% over expected value) (source: Duffield 2008)
| Full period | Stage 1 | Stage 2 | Stage 3 | |
| No of observations | 40 | 45 | 43 | 40 |
| Traditional projects >5% over expected | 56.7% | 50.0% | 48.5% | 43.3% |
| PPP projects > 5% over expected | 40.0% | 46.7% | 50.0% | 30.0% |
| Difference (Traditional - PPP) | 16.7% | 3.3% | -1.5% | 13.3% |
Comparison of the Stage 2 results with those obtained by NOA [4] indicate that Australian traditional projects perform better in respect to cost than comparable UK projects and that on this metric there is little difference between PPPs and Traditional projects from the period from Budget Approval to Final. Based on this metric PPPs provide a better cost outcome than Traditional projects for all other time periods.