State Highway Revenue Analysis
NCSL used the Highway Statistics series on State Highway Finance, produced by the Federal Highway Administration (FHWA),1 to analyze state revenues used for highways to determine trends and patterns. Data was aggregated from 1999 through 2004, combined by revenue category, and then divided by total receipts by states for those years to derive a percentage that each state received in nine revenue categories (see table 7). The categories used by the FHWA include:
• Motor fuel taxes.
• Motor vehicle and motor carrier taxes.
• Road and crossing tolls.
• Appropriations from general funds.
• Other state imposts.
• Miscellaneous revenues.
• Bond proceeds. (Bond proceeds are included as a revenue source to show the states' use of this transportation funding source. However, since bonds are repaid with some of the other revenue sources listed, some double-counting of revenue is contained in this analysis.)
• Payments from federal funds.
• Payments from local governments.
Table 7. Total Revenues Used By States For Highways from 1999-2004, by Percentage of Total Annual Receipts | |||||||||
State/ Jurisdiction | Motor-Fuel Taxes | Motor Vehicle and Motor Carrier Taxes | Road and Crossing Tolls | Appropriations from General Funds | Other State Imposts | Miscellaneous | Bond Proceeds* | Payments from Federal Funds | Payments from Local Govt's |
Alabama | 37.9% | 13.4% | 0.0% | 3.5% | 0.5% | 0.6% | 2.3% | 40.7% | 1.1% |
Alaska | 4.7 | 4.9 | 3.2 | 19.5 | 0.0 | 4.3 | 3.5 | 54.1 | 5.7 |
Arizona | 25.5 | 9.8 | 0.0 | 4.4 | 19.3 | 1.9 | 15.0 | 19.5 | 4.5 |
Arkansas | 38.9 | 11.6 | 0.0 | 2.6 | 0.2 | 2.5 | 9.6 | 34.0 | 0.7 |
California | 35.9 | 20.6 | 3.4 | 3.3 | 3.1 | 3.1 | 1.5 | 22.5 | 6.6 |
Colorado | 27.6 | 19.2 | 0.0 | 3.5 | 5.3 | 2.9 | 20.4 | 19.8 | 1.2 |
Connecticut | 21.2 | 11.0 | 0.0 | 2.3 | 1.7 | 6.7 | 29.3 | 27.0 | 0.7 |
Delaware | 14.4 | 12.7 | 20.2 | 6.8 | 0.0 | 4.3 | 26.0 | 15.7 | 0.0 |
Florida | 28.5 | 12.7 | 12.6 | 0.8 | 2.0 | 2.8 | 13.7 | 24.5 | 2.5 |
Georgia | 16.4 | 10.1 | 1.1 | 10.1 | 9.8 | 4.6 | 7.9 | 39.9 | 0.0 |
Hawaii | 19.8 | 22.1 | 0.0 | 3.2 | 0.6 | 5.4 | 14.2 | 34.7 | 0.0 |
Idaho | 37.2 | 22.0 | 0.0 | 0.0 | 0.0 | 0.1 | 0.0 | 39.8 | 0.8 |
Illinois | 29.7 | 25.8 | 9.4 | 1.1 | 0.7 | 1.4 | 9.1 | 21.8 | 1.0 |
Indiana | 34.3 | 9.8 | 3.6 | 2.4 | 0.0 | 0.6 | 19.8 | 26.3 | 3.1 |
Iowa | 28.6 | 25.2 | 0.0 | 4.4 | 17.3 | 0.8 | 0.0 | 23.7 | 0.0 |
Kansas | 23.7 | 8.0 | 4.2 | 1.2 | 9.0 | 3.5 | 27.9 | 21.1 | 1.4 |
Kentucky | 26.4 | 35.7 | 0.5 | 3.2 | 0.0 | 4.2 | 0.2 | 29.7 | 0.0 |
Louisiana | 40.0 | 9.6 | 2.4 | 7.1 | 2.0 | 2.0 | 5.6 | 31.3 | 0.0 |
Maine | 29.3 | 9.8 | 10.1 | 17.5 | 0.0 | 1.2 | 6.0 | 26.0 | 0.0 |
Maryland | 26.9 | 23.3 | 7.0 | 0.7 | 6.2 | 2.3 | 8.1 | 25.3 | 0.1 |
Massachusetts | 17.1 | 7.5 | 6.0 | 23.7 | 0.0 | 5.8 | 25.4 | 14.5 | 0.0 |
Michigan | 34.3 | 27.2 | 1.1 | 4.9 | 0.6 | 2.8 | 4.3 | 23.5 | 1.4 |
Minnesota | 33.3 | 29.9 | 0.0 | 2.6 | 5.0 | 3.4 | 3.4 | 21.2 | 1.2 |
Mississippi | 36.6 | 12.7 | 0.0 | 0.8 | 6.2 | 1.3 | 9.0 | 32.5 | 1.0 |
Missouri | 32.1 | 11.2 | 0.0 | 0.6 | 10.8 | 1.0 | 9.4 | 33.4 | 1.4 |
Montana | 34.0 | 10.3 | 0.0 | 0.0 | 0.0 | 0.5 | 0.0 | 54.6 | 0.5 |
Nebraska | 36.6 | 8.7 | 0.0 | 3.0 | 17.6 | 1.5 | 0.0 | 25.8 | 6.8 |
Nevada | 49.1 | 16.1 | 0.0 | 0.8 | 0.0 | 2.1 | 6.9 | 24.8 | 0.1 |
New Hampshire | 27.7 | 16.9 | 13.4 | 0.7 | 0.0 | 2.6 | 7.9 | 29.1 | 1.6 |
New Jersey | 7.0 | 7.0 | 12.2 | 4.0 | 0.0 | 3.0 | 39.7 | 27.1 | 0.0 |
New Mexico | 18.2 | 16.5 | 0.0 | 6.0 | 0.5 | 1.4 | 32.2 | 25.0 | 0.2 |
New York | 18.0 | 9.9 | 15.8 | 3.3 | 0.1 | 1.5 | 28.9 | 22.2 | 0.3 |
North Carolina | 37.4 | 11.2 | 0.1 | 3.8 | 11.8 | 4.0 | 2.4 | 29.0 | 0.3 |
North Dakota | 25.2 | 13.6 | 0.0 | 8.0 | 1.4 | 0.2 | 0.0 | 48.0 | 3.4 |
Ohio | 41.7 | 16.8 | 5.3 | 0.4 | 0.0 | 2.7 | 7.6 | 24.2 | 1.4 |
Oklahoma | 22.1 | 15.0 | 11.7 | 5.8 | 3.0 | 2.7 | 12.1 | 26.7 | 0.7 |
Oregon | 33.6 | 23.3 | 0.0 | 3.0 | 0.5 | 1.8 | 4.2 | 33.6 | 0.0 |
Pennsylvania | 32.0 | 14.5 | 9.8 | 5.0 | 0.0 | 4.4 | 9.2 | 24.5 | 0.4 |
Rhode Island | 23.4 | 9.9 | 3.4 | 1.8 | 0.0 | 1.7 | 16.6 | 43.3 | 0.0 |
South Carolina | 30.9 | 8.3 | 0.3 | 4.8 | 0.0 | 2.3 | 10.1 | 42.7 | 0.5 |
South Dakota | 24.8 | 10.9 | 0.0 | 0.0 | 11.9 | 4.0 | 0.0 | 46.2 | 2.2 |
Tennessee | 43.7 | 14.9 | 0.0 | 4.0 | 1.8 | 3.0 | 0.0 | 30.6 | 1.9 |
Texas | 31.0 | 23.0 | 2.0 | 0.3 | 0.5 | 2.7 | 1.4 | 35.2 | 3.9 |
Utah | 28.8 | 7.3 | 0.0 | 12.8 | 3.0 | 2.7 | 22.4 | 22.8 | 0.2 |
Vermont | 23.4 | 29.3 | 0.0 | 1.2 | 0.3 | 3.0 | 0.6 | 41.6 | 0.6 |
Virginia | 23.7 | 19.9 | 2.9 | 3.0 | 13.5 | 2.5 | 12.9 | 20.3 | 1.4 |
Washington | 32.4 | 18.4 | 5.0 | 1.2 | 0.0 | 2.3 | 14.9 | 24.4 | 1.4 |
West Virginia | 26.0 | 20.5 | 4.6 | 3.8 | 0.1 | 1.4 | 9.7 | 33.9 | 0.0 |
Wisconsin | 38.4 | 15.7 | 0.0 | 0.0 | 0.0 | 1.6 | 11.7 | 28.3 | 4.2 |
Wyoming | 21.9 | 10.3 | 0.0 | 0.4 | 2.8 | 1.3 | 0.0 | 62.7 | 0.6 |
District of Columbia | 9.2 | 21.0 | 0.0 | 13.4 | 6.3 | 3.2 | 3.8 | 43.1 | 0.0 |
Totals | 28.3% | 15.9% | 5.0% | 4.0% | 3.2% | 2.7% | 12.4% | 26.8% | 1.7% |
* Includes bond proceeds as a revenue source, which leads to some double-counting of revenues. Source: NCSL Compilation from Highway Statistics, Finance Series, Federal Highway Administration, Table SF-1, 1999-2004. | |||||||||
Based on the six-year average of highway revenues by state, the analysis shows the following state average percentages by category:
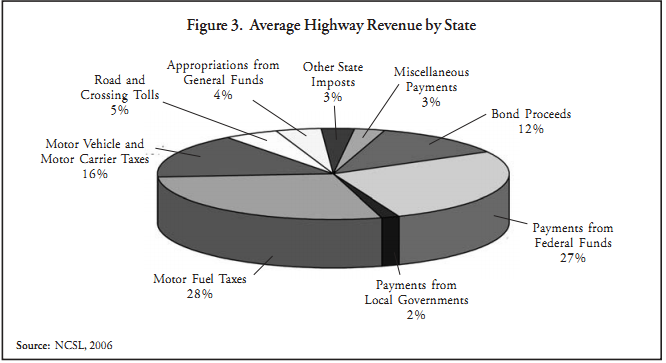
State motor fuel taxes and federal payments, which consist largely of federal motor fuel taxes, make up the largest shares and together account for more than 55 percent of all revenue spent for highways. The next significant revenue source is motor vehicle and motor carrier taxes and fees, accounting for nearly 16 percent. Annual average bond proceeds account for 12.43 percent, while the rest each account for less than 5 percent.
This data is useful in comparing individual states to the national average and determining if a particular state may have additional capacity to use a funding source that may be underutilized, compared to the national average. Conversely, the data also indicate if a particular state is overly dependent on a particular revenue source as compared to the national average. The caveat is that each state has unique demographic, geographic and transportation characteristics that must be considered in addition to the national comparisons.
For example, 15 states have no revenue under the category of other state imposts. These states may wish to explore this category, which includes a variety of sources designated for transportation, including sales and use taxes, oil royalties, severance taxes, traffic impact fees, specific ownership taxes, corporate income taxes, special assessments and special taxing districts. Miscellaneous revenues include items such as billboard permits, rental car fees and sale of surplus property. Connecticut, Hawaii and Massachusetts generate more than 5 percent of their transportation revenues from miscellaneous sources.
In the toll category, 21 states have had no toll income during the past six years, compared with the average state revenue collection through tolls of 5 percent. This may be an area of potential revenue growth in the states where tolls are feasible and politically acceptable.
Seven states use no bond proceeds to build roads, although the national average is during 12 percent. This is due to state constitutional or statutory prohibitions on incurring indebtedness.
Several states show possible overreliance on certain funding sources compared to the national average. For example, seven states rely on bond proceeds for more than 25 percent of total receipts for highways, which is double the national average. With such reliance on debt, these states may face future bond repayment difficulties as did New Jersey in 2006.
States that have an above average reliance on the state gas tax may face funding declines as the purchasing power of the gas tax continues to erode. Twelve states depend on state gas taxes for more than 35 percent of their funding; the national average is 28 percent. Some states, due to small geographic size and small number of lane-miles, simply cannot generate the national average in gas tax collections.
Payments from federal funds varies from about 63 percent in Wyoming to 14.5 percent in Massachusetts; the average is about 27 percent.
The importance of motor vehicle and motor carrier taxes varies, ranging from a high of 36 percent in Kentucky to a low of less than 5 percent in Alaska. The national average is about 16 percent.
Local government payments to states are more than 5 percent in Alaska, California and Nebraska, denoting strong local revenue collection efforts.
In any of these categories, states with averages well over or well under the national average may want to consider a more balanced approach to the collection of transportation revenue. This can help to protect against unforeseen changes that could decrease funding in particular categories and contribute to a more robust funding structure. As noted, characteristics particular to each state must be considered in addition to the national comparisons.