Correction
Report by the Comptroller and Auditor General
Implementing transparency
HC 1833 Session 2010-12
ISBN 978-0-10-297550-5
Ordered by the House of Commons to be printed on 16 April 2012
CORRECTION
An error within one piece of analysis requires corrections to Figure 5 and paragraph 3.20.
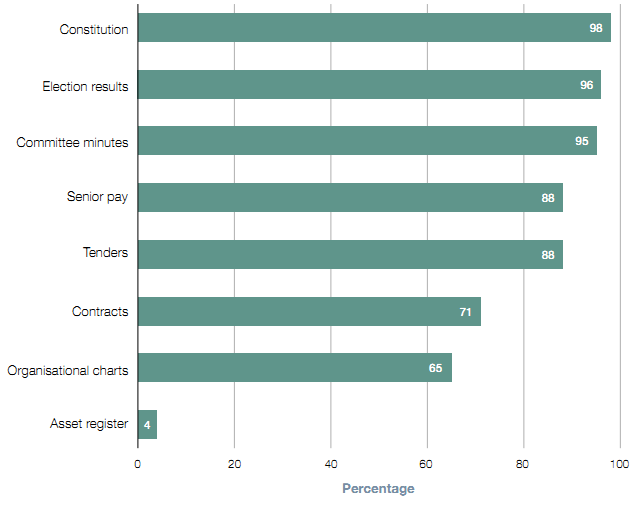
Figure 5 (page 27) of the report requires two corrections:
a The proportion of local authorities publishing organisational charts should be 65 per cent instead of 63 per cent; and
b The proportion of local authorities publishing asset registers should be 4 per cent instead of 5 per cent.
Please see the corrected figure below:
Figure 5
NOTES 1 Based on a review of 202 local authority websites undertaken in November 2011. 2 Tender and contract information includes information published on external websites. Source: National Audit Office analysis |
Paragraph 3.20 (page 27) of the report requires three corrections. Please see the original paragraph below:
3.20 We also reviewed whether councils had published their expenditure data over £500 timeously and in machine-readable formats. Of the 202 councils we reviewed, 89 per cent have published the data by month, with one example of weekly releases and 91 per cent have published data in a non-proprietary, machine-readable format. At the time of our review, 80 per cent had produced data from the previous month, though in 7 per cent of cases, spending transaction data were four or more months old.
Please see the corrected paragraph below:
3.20 We also reviewed whether councils had published their expenditure data over £500 timeously and in machine-readable formats. Of the 202 councils we reviewed, 89 per cent have published the data by month, with one example of weekly releases and 88 per cent have published data in a non-proprietary, machine-readable format. At the time of our review, 82 per cent had produced data from the previous month, though in 4 per cent of cases, spending transaction data were four or more months old.