Costs
| 22 Little detailed financial information is available on a like-for-like basis about both PFI and non-PFI new schools. What information there is showed considerable variation between schools in unit capital costs, but no statistically significant differences between PFI and traditionally funded schools. 23 At present it is too early to make any judgements about the extent to which PFI contractors will keep schools in good repair. But it was possible to examine their plans for the future by looking at projected maintenance costs in relation to capital costs. There was four-fold variation in both construction and lifecycle unit costs, and a positive correlation between initial capital costs and provision for whole-life maintenance [Exhibit 5, overleaf], where a negative correlation might be expected if decisions were being made to trade one off against the other. 24 We also compared the cost of FM services under PFI schemes (as defined in the financial model and therefore underpinning the monthly payment) with that of traditionally funded schools, to see whether the early PFI schemes had achieved lower costs. The comparisons were made against a database of the running costs of non-PFI schools, updated annually by the Audit Commission. II There were no statistically significant differences between PFI and other schools in the costs of buildings maintenance, grounds maintenance, water and sewerage or fuel. | |
| Exhibit 5 | |
| There was a positive correlation between initial capital costs and provision for whole-life maintenance. | |
| Lifecycle costs (£/m2) | |
|
Source: Audit Commission financial data sample, repriced to third quarter of 2001 |
Construction costs (£/m2) |
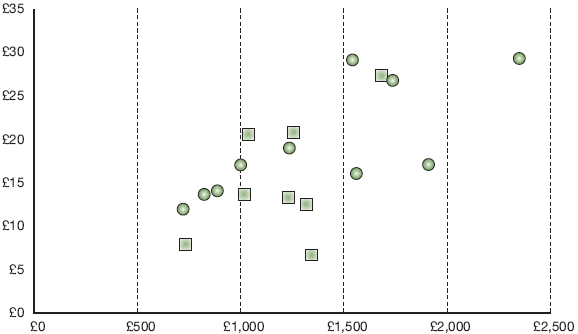
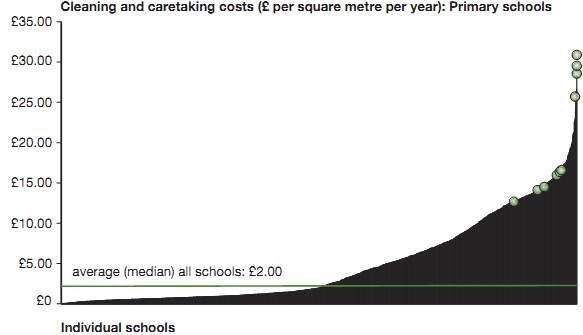
| 25 However, the average cost of cleaning and caretaking - on the limited evidence available - appeared to be higher in PFI schools [Exhibit 6]. This reflects interview findings, with PFI schools often reporting that their cleaning service was to a higher standard than before. This probably results from changed circumstances and incentives. Previously, compulsory competitive tendering (CCT) often resulted in reduced service levels and costs, reflected in the traditional schools' average costs. Under PFI however, while contractors still have an incentive to be competitive in overall bid price, they also have an incentive to offer a better level of service in return for higher charges. And the client side will be keen to specify as high a level of service as possible for the given price. This different combination of incentives under PFI may explain the above average costs. A more expensive service is justifiable if service levels are of a higher quality than those received by schools that pay less, and if the school and LEA have decided that they wish to pay for a higher-quality service as a priority for expenditure. | |
| Exhibit 6 The average cost of cleaning and caretaking is higher in PFI schools. | |
|
Traditional costs are actuals reported by schools. PFI costs were derived from providers' financial models and therefore represent the estimated costs underpinning the actual unitary charge. Costs have been adjusted to a comparable price base (2000/01). |
|
| Source: Audit Commission schools running costs database and PFI sample | |


__________________________________________________________________________________
II Available at www.schools.audit-commission.gov.uk