II. Transportation PPPs-Experience to Date
It is difficult to estimate the total value of transportation PPP projects given the various definitions of PPPs across countries and sectors. "Private investment in infrastructure" does not equal PPP funding, because it may include privatization contracts, while not all PPPs have a private financing component, as explained in the previous section.18 Public Works Financing maintains a database of PPPs from around the world and uses the British Private Finance Initiative PPP definition for cross-country comparisons.19
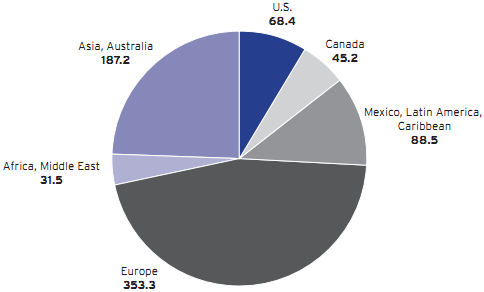
By any measure, the United States is a laggard in terms of PPP projects. Between 1985 and 2011, there were 377 PPP infrastructure projects funded in the United States, only 9 percent of total nominal costs of infrastructure PPPs around the world. Europe leads the infrastructure PPP market, concentrating more than 45 percent of the nominal value of all PPPs (Figure 1).
With regard to just transportation projects, Public Works Financing records 104 PPPs (including design-build), between 1989 and 2011.20 Most of them (81 percent) are for highways, bridges, and tunnels both in terms of number of projects and value. The rest are for rail projects, save the construction of International Air Terminal at John F. Kennedy Airport in New York, which is the nation's only airport PPP project.
The design-build form of PPP has been the most intensely used over the years in the United States representing 67 percent of the total number of PPPs, but only 52 percent of the cumulative value of the projects. More complex versions of PPPs where the private partner designs, builds, finances, operates, and maintains the facility (a DBFOM project type) show a reversed trend, with only 12 percent of projects, but 24 percent of the contracted amount. Showing the increasing sophistication of the United States market, seven of the twelve projects of this type have been implemented between 2008 and 2010 (Figure 2).
Figure 1. Public/Private Partnerships (PPPs) Worldwide, |
|
Note: Includes funded road, rail, buildings, and water projects through October 2011 in nominal dollars converted into U.S. dollars at the time of financial close. Excludes U.S. design-build projects. Source: PWF, 2011 |
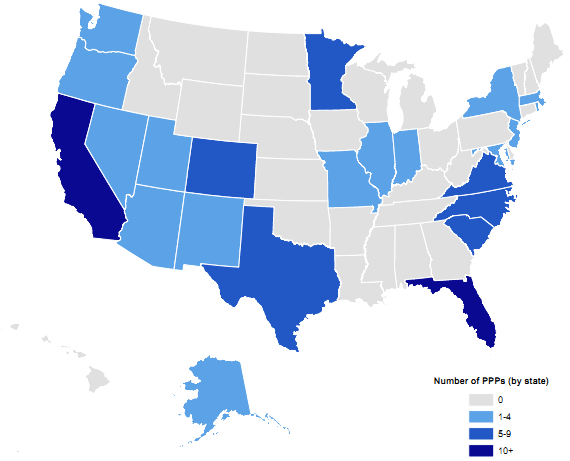
Twenty-four states undertook at least one transportation PPP project, including design-build, between 1989 and 2011. Western and Southern states tend to be at the forefront on PPP adoption accounting for 34 and 38 percent, respectively, of the number of PPP projects over the last 23 years. Florida (16) has the largest number, followed by California (12), and Texas (9). These three states, along with Colorado and Virginia, were responsible for 56 percent of the total amount of all U.S. transportation PPP projects from 1989 to 2011. By contrast, the Midwestern and Northeastern states have been slow in implementing PPPs (Figure 3).
Most of the transportation PPP projects are located in the top 100 metropolitan areas, reflecting the higher demand for transportation services. Eighty-two percent of all transportation PPPs contracted between 1989 and 2011 are located in 32 of the top 100 metro areas (Appendix A). These projects represent 88 percent of the total value of U.S. transportation PPP investment over the last twenty-three years. As found in the state analysis, most of the projects are located in Southern and Western metros, with only six Northeastern and Midwestern top 100 metros having contracted any PPP projects.
While metropolitan Los Angeles holds the top spot in terms of the number of transportation PPP projects, Washington, D.C. dominates when it comes to the total value of PPP projects. The transportation authorities in this region have been developing PPP projects since 1993, pursuing not only design-build projects, but also the complex DBFOM projects. The eight PPP transportation projects in the Washington metro area, two which are rail projects, are worth $7.2 billion in total. In general, PPP projects are found in the largest metro areas including New York, Dallas, Miami, and Chicago. However, there is no one-to-one relationship between the value of the PPP contracts and metro economy size. For example, top 10 metro economies such as Houston, Philadelphia, and Atlanta have not contracted any while smaller metros like Denver and Austin have projects worth billions of dollars.
Figure 2. Transportation PPPs in the United States, 1989-2011 |
|
Includes design-build projects. Note: Annual totals in 2011 billions of dollars. The nominal values of the cumulative contract amounts were adjusted using the GDP price deflator. Source: PWF, 2011; BEA, 2011 |
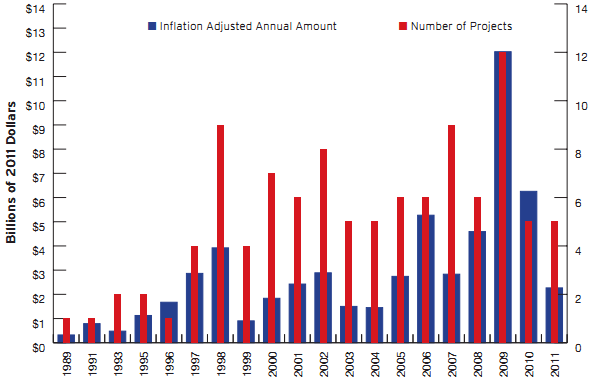
Figure 3. Transportation PPPs by State, Number of Projects, 1989-2011 |
|
Note: includes design-build projects. Source: PWF, 2011 |
Despite this activity, the data shows that the United States has been slow to pursue PPPs in comparison with European and Asian countries. There appear to be several discrete, but related, reasons. In some cases, there is lack of institutional capacity and expertise in some cities and states to properly promote the benefits and costs of PPP deals. In Pittsburgh, an arrangement to lease the city's parking operations to a private entity collapsed when the city council voted against the transaction. At the same time, the deals are getting more complex, politically heated, and cumbersome as some stretch across jurisdictions, and even international borders as is the case with the New International Trade Crossing intended to connect Detroit to Windsor, Ontario. And with state and municipal finances under strain, the public sector is also trying to transfer greater responsibility to the private sector, including project financing.
In this regard, the U.S. Government Accountability Office recently noted that while the United States has done much to promote the benefits of PPPs it needs to do more to assist states and metro areas to think through potential costs and trade-offs, as well as assessing national interests.21 A possible solution is the creation of specialized institutional entities to assist with the expanding opportunities for PPPs. The next section discusses how these so-called "PPP units" fulfill different functions such as quality control, policy formulation and coordination, technical advice, standardization and dissemination, and promotion of PPPs.