2.0 TRANSPORTATION INFRASTRUCTURE INVESTMENTS ARE NOT KEEPING UP WITH GROWING HIGHWAY DEMAND
Since 1900, the population of Texas has increased approximately 20 percent every ten years. Demographic projections indicate that Texas will add between 12.5 and 16 million new residents between now and 2030.3 Since 1990, the vast majority of the state's population growth has occurred in the major metropolitan areas, with especially high rates of growth occurring in the suburban counties surrounding the state's largest cities. Demographers expect this trend to continue.4
These new residents have meant more vehicles on Texas highways. For the past decade, the ratio of registered vehicles to the state's population has hovered around 0.85 vehicles per person (up from 0.75 in 1980).5 Unfortunately, the number of lane-miles has not kept up with the increases in population and vehicles. Since 1980, the number of vehicles per lane-mile has increased by 57 percent.6 The increased congestion is apparent even to casual users of our highways.
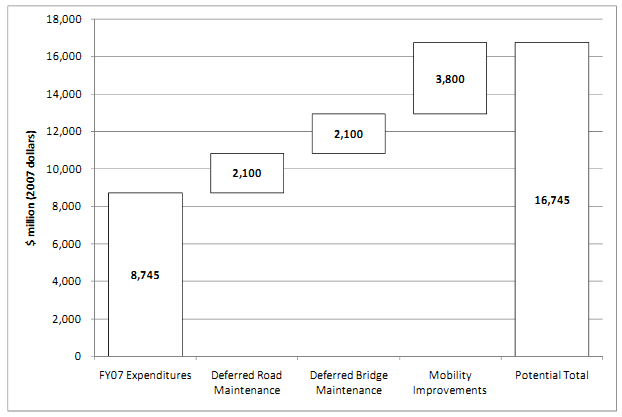
Compounding this problem, Texas suffers from a growing backlog of deferred maintenance for both roads and bridges. TxDOT has estimated that 14 percent of the "on system" bridges and 39 percent of the "off system" bridges are in substandard condition.7 Correcting these deficiencies will require an investment of $17.2 billion over the next ten years.8 The situation for roads is little better. For the last ten years, roughly one in seven road miles in Texas has fallen short of "good" or "better" condition, and preliminary estimates are that an amount at least equal to that required for bridge repair will be needed to bring our deficient roads up to an acceptable standard.9
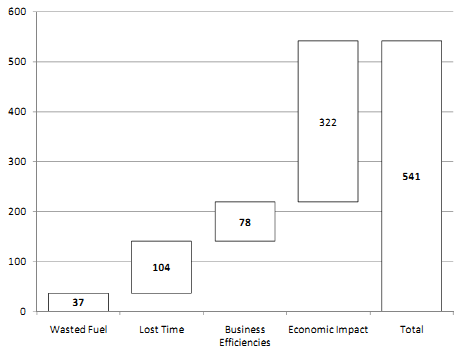
Failure to act will carry significant economic consequences. In 2006, the Governor's Business Council estimated that alleviating traffic congestion in the state's eight largest metropolitan areas would, between 2007 and 2030 save Texans $37 billion in wasted fuel, along with $104 billion in lost time. 10 On an annual basis, Texans waste over $1.5 billion in fuel and suffer $4.3 billion in lost time due to current traffic congestion,11 and this does not take into account the business efficiencies and economic impact of additional road construction.
ECONOMIC IMPACT OFMETRO AREA CONGESTION
2007-2030 COMBINED IMPACT ($ BILLION; 2006 DOLLARS)
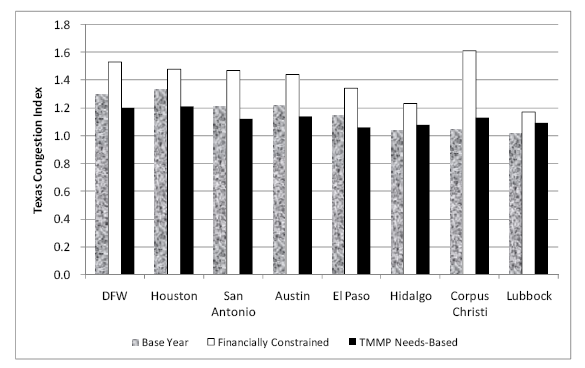
The GBCs savings estimates were based on moving from a "financially constrained" scenario - based on existing sources of revenue - to a "needs based" system, which is focused on eliminating all locations of serious congestion. The target is to reduce the Congestion Index to a level of about 1.15.12
Closing this funding gap will require a significant increase in the amounts that Texas now spends on our highway system. The GBC estimated that the total investment required to achieve the needs-based objectives will total approximately $44 billion between 2006 and 2030, and this figure did not include the roughly one-third share borne by local governments (an additional $22 billion), nor did it include rural areas or metro areas outside of the eight noted above.13
The point, for the purposes of this report, is not to derive an exact number, but to make the Legislature aware that whatever the final financial capacity amount proves to be, it will likely be much higher than TxDOT's current level of expenditures (the 2030 Committee is working to pinpoint more exact figures).
ESTIMATED ANNUAL NEEDS-BASED FUNDING REQUIREMENTS (2007 DOLLARS)
Given the need for additional funding, the question becomes from where will these dollars come? During the various public hearings, the Committee heard testimony regarding the existing sources of funding, as well as other possibilities to increase the revenue of the State Highway Fund (Fund 6). Among these were:
• Eliminate the current diversions from the State Highway Fund
• Recover Texas' full contribution to the Federal Highway Trust Fund
• Index and/or raise the state motor fuels tax.
Each of these options carries its own set of issues and practical limitations. As this report will show, none will fully solve Texas' transportation funding challenges.
Traditionally, Texas has funded its roads from a combination of the state motor fuels tax and allocations from the Federal Highway Trust Fund, which is itself funded via the federal motor fuels tax.
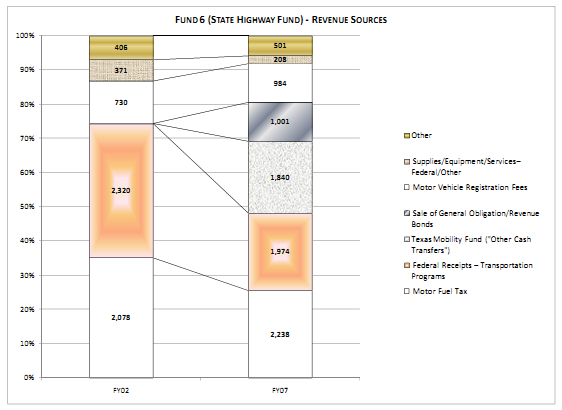
STATE HIGHWAY FUND (FUND 6) REVENUE SOURCES – FY02 AND FY0714
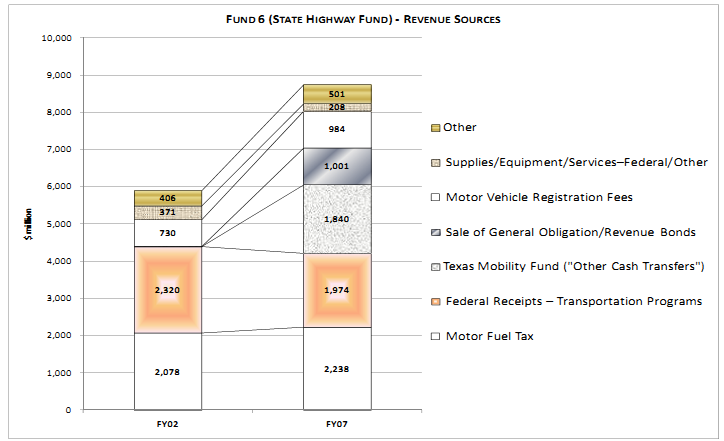
The total amount of Fund 6 revenue has increased substantially within the past five years. However, the relative proportion of the traditional sources has declined from 75 percent in FY02 to less than half in FY07. Since FY02, almost all of the Fund 6 revenue increases have derived from bond proceeds.15
STATE HIGHWAY FUND (FUND 6) REVENUE SOURCES – FY02 AND FY07 – PERCENTAGE BASIS
_________________________________________________________________________________
3 The US Census Bureau projects 12.4 million new residents, while the Texas State Data Center predicts 16 million new residents by 2030.
4 The top ten fastest growing counties since 1990: Rockwall, Collin, Williamson, Montgomery, Fort Bend, Denton, Hays, Kendall, Comal and Burnet.
5 US Census (population data). Texas Comptroller's Office (registered vehicles).
6 Texas Comptroller (Texas motor vehicle registrations 1996-2005); Federal Highway Administration Tables MV201 (Texas motor vehicle registrations to 1995); FHWA Table HM60 (lane-miles)
7 TxDOT Sunset Advisory Commission Staff Report, p. 100.
8 Source: TxDOT.
9 Note that the 2030 Committee has been charged with refining the estimates for the dollars required to correct the existing road and bridge maintenance deficiencies and is expected to issue its report by the end of 2008.
10 Governor's Business Council, Shaping the Competitiveness of Texas Metropolitan Regions, (the "GBC Report"). The regions studied were Dallas-Fort Worth, Houston, San Antonio, Austin, El Paso, Hidalgo County, Corpus Christi and Lubbock.
11 The GBC calculated wasted fuel at $2.80 per gallon, and lost time at $13.75 per hour.
12 The Texas Congestion Index is the ratio of the time required to travel a given distance during peak traffic vs. free flowing conditions. An index of 1.5 means that a given trip would take 50% longer in peak traffic.
13 Estimates do vary for the rural and other metro areas. For the purposes of this report, we note only that estimates were roughly $9 billion for the other metro areas (combined), and that they ranged from $3 billion to $9 billion for the rural areas of Texas.
14 Source: Texas Annual Cash Report 2002 and 2007
15 This report will address the specifics of these bond revenues on subsequent pages. We note, too, that bond proceeds, unlike other sources of revenue, must eventually be paid back - a fact that many seem to have ignored in the run-up to the latest credit crisis.