2.3. Index and/or Raise the State Motor Fuels Tax
The motor fuels tax currently sits at 20 cents per gallon for both gasoline and diesel, a figure that was last raised in 1991 and is not indexed to inflation. Texas's motor fuels taxes are low relative both to other states and to countries in the developed world.29
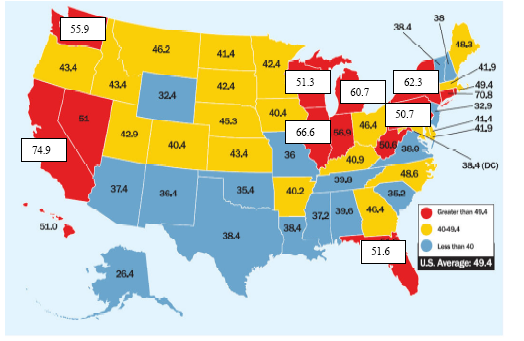
COMBINED FEDERAL, STATE & LOCAL GASOLINE TAXES – 2008 30
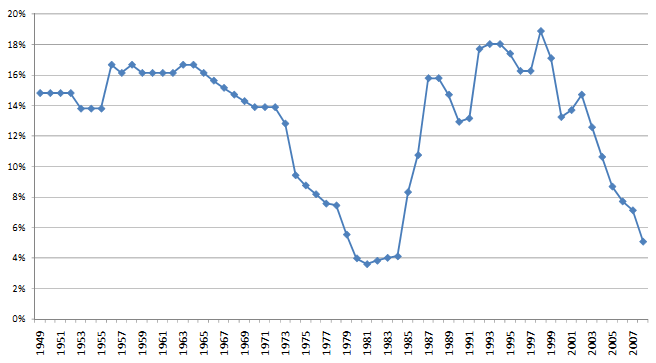
Since the motor fuels tax is set on a cents per gallon basis, its level varies relative to the price of fuel. Currently, the tax as a percentage of the pump price is near historic lows.31
STATEMOTOR FUEL TAX AS A PERCENTAGE OF THE PUMP PRICE 1949-2008
For the last ten years, the average motorist in Texas has paid between 1.2 and 1.3 cents per mile traveled in state motor fuel taxes. This translates into a cost of roughly $150 per year per registered vehicle. Add the federal tax and the average Texas driver pays around $300 in annual state and federal fuel taxes.32 In effect, the cost of operating the system is no longer being supported by Texas motorists. While many think they are paying too much, the truth is that Texas road users are not covering the operating or capital cost of the system.
Putting this into another perspective, the U.S. Department of Transportation estimates that driving on roads in need of repair costs Texans more than $4.5 billion in annual auto repair costs, or $326 per motorist.33 Texas drivers thus pay more, on average, to repair damage to their vehicles caused by bad road conditions than they pay to drive those roads in the first place!34
It is difficult to escape a central point: the current gasoline and diesel taxes do not cover the total costs of road usage. For instance, estimates from other states indicated that Operations and Maintenance ("O&M") costs for rural interstates run at roughly 2.5 cents per vehicle lane-mile.35 This does not include the far higher cost for amortization of the highway's construction expenses, which vary widely depending on the urban/rural nature of the road as well as a number of specifically local factors. Estimates we have seen range from ten to fifteen cents per vehicle lane-mile.36
One option - and the simplest - would be to raise the fuel tax rate. At current levels of fuel consumption, each one cent increase would bring in an additional $110 million in Fund 6 revenue (net of the amount taken for public education).
Another option would be to change the fuel tax to an ad valorem tax based on a percentage of the fuel price (much like the state's sales tax operates today). The downside to this approach is that fuel prices can be quite volatile, which would add to the difficulties of long range transportation planning.
In the end, whether to raise the motor fuel tax and by what amount is a policy matter for the Legislature, and we will address the impact of higher fuel prices on consumption - via tax increase or otherwise - later in this report.
Another option is to index the tax to inflation. Like most other states, Texas does not currently do this, and the purchasing power of the motor fuels tax declines each year.37 Using the CPI, the 20 cents per gallon tax in 1991 translates into approximately 14 cents per gallon of purchasing power today.
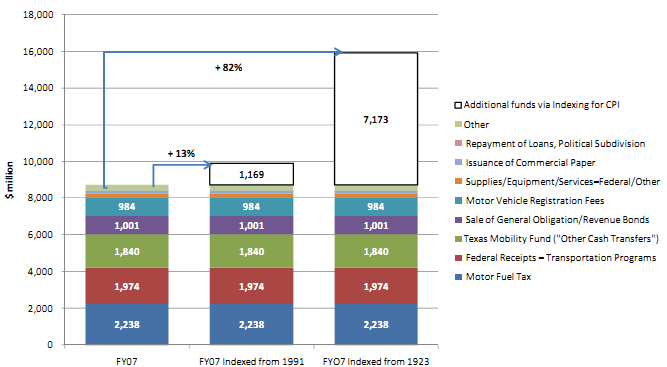
Since we have no crystal ball, we will not attempt to forecast inflation rates decades into the future. Instead, we examined the impact of various indexing possibilities based on historic inflation data. If Texas had indexed the motor fuels tax to the CPI the last time the Legislature raised the tax in 1991, the current rate would be 29.6 cents per gallon, which would bring in approximately $1.2 billion in net revenue to Fund 6 (after education funds are taken out). Had Texas indexed the tax to inflation at its inception in 1923, the current rate would be 84.1 cents per gallon, which, net of education, would produce $7.1 billion of additional revenue.
HYPOTHETICAL INFLATION-ADJUSTED MOTOR FUELS TAX (CPI)
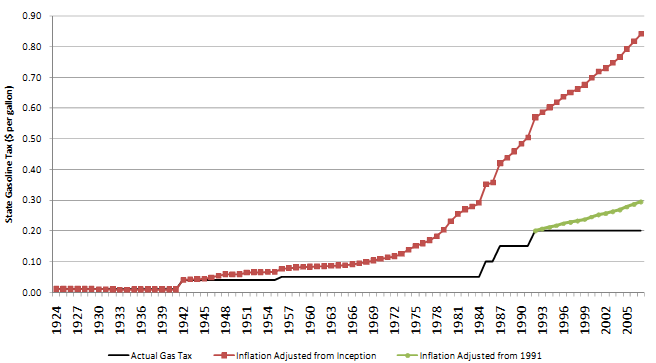
While indexing the motor fuel tax to inflation would be a useful step to maintain the tax's purchasing power, in raw dollar terms, the increases for the first several years will be quite limited. As with any measure of compound interest, the largest gains only occur over long periods of time.
ADDITIONAL REVENUE TO FUND 6 FROM INDEXING THE MOTOR FUEL TAX SINCE 1991 (CPI)
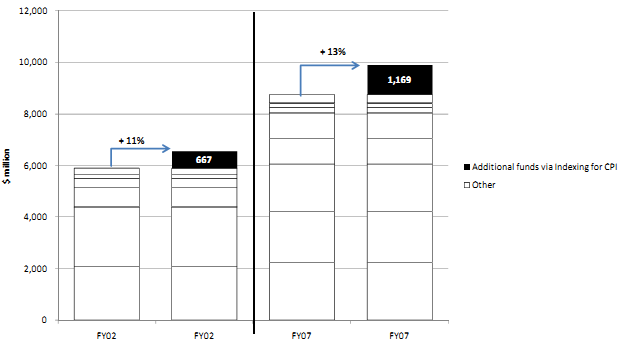
These charts also make the critical assumption that increases in the tax rate do not affect consumption volume - a subject we will subsequently address in more detail.
ADDITIONAL REVENUES TO FUND 6 OF INDEXING THE FUEL TAX TO THE CPI – SINCE INCEPTION IN 1923
The choice of index measure is equally important. During the past few years, the costs of materials used in construction have risen faster than consumer price inflation as developing nations spend vast sums to build and upgrade their own transportation infrastructure.38
However, it is important to note that prices for construction materials are quite volatile. The past forty years have also witnessed long periods where the Highway Cost Index significantly lagged behind the CPI, and the prices of industrial commodities can fall just as quickly as they rise.39
US CONSUMER PRICE INDEX40 VS. FEDERAL HIGHWAY COST INDEX41 (LOG SCALE)
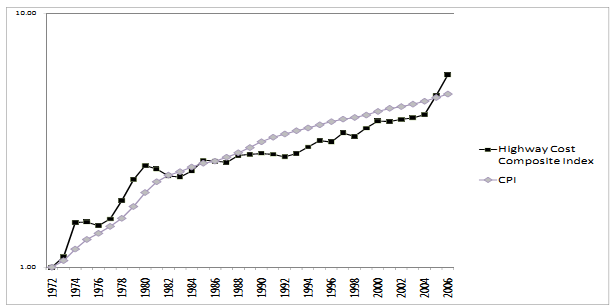
The policy choice is this: should Texas choose the more steady CPI measure, or run the risk of indexing fuel taxes to the Highway Cost Index at a peak in construction costs,42 thereby lagging the CPI and producing less revenue in the long run?
__________________________________________________________________________________
29 The Committee notes, however, that unlike the US, most other developed nations use the fuel tax to raise general revenue and/or to achieve separate policy objectives (i.e., environmental).
30 Source: American Petroleum Institute. Unlike Texas, some of the higher-tax states impose sales taxes on motor fuels. Many others impose additional city/county levies, environmental taxes, and underground storage tank fees.
31 Average prices in Texas for regular unleaded reached $3.98 per gallon in July 2008, though current prices as of mid November 2008 have dropped below $2.00 per gallon. The average price for all of 2008 (through November 3) is $3.38 per gallon. Source: Energy Information Administration, US Department of Energy.
32 Based on an average of 16.1 miles per gallon. Data derived from the Federal Highway Administration (miles
driven), the Texas Comptroller (taxable gallons), and TxDOT (number of registered vehicles).
33 Comptroller of Public Accounts, Fiscal Notes, June 2008 - based on estimates by the US Dept of Transportation.
34 Higher repair costs also have the additional disadvantage of unpredictability, with the burden often falling on those who are least able to afford them and are most dependent on one vehicle.
35 As an example, the Pennsylvania Department of Transportation estimated its O&M costs for Pennsylvania's 311 miles of Interstate 80 to be $100 million per year, which translates to $321,543 per mile, or $80,386 per lane-mile. Extrapolating this figure to the traffic volumes found on busy rural Texas interstates - for example, Interstate 20 near Tyler - yields a figure of 2.5 cents per vehicle lane-mile. We do note that Texas costs could be lower. Pennsylvania must contend with more severe winter weather, among other factors. However, even if Texas' O&M costs are as low as 60% of Pennsylvania's, this still means a cost of 1.5 cents per vehicle lane-mile, a figure higher than that raised by the state motor fuels tax.
36 The 2030 Committee is expected to address this issue more comprehensively.
37 States that index their motor fuels tax to inflation include Maine, Florida, New York (petroleum business tax, not the gasoline tax), Nebraska (a partial percentage tax rather than a fixed amount). Wisconsin once indexed their motor fuels tax, but repealed this provision in 2006. Source: Federation of Tax Administrators
38 The prices of earth-moving equipment and component parts have also risen quickly due to a global mining boom.
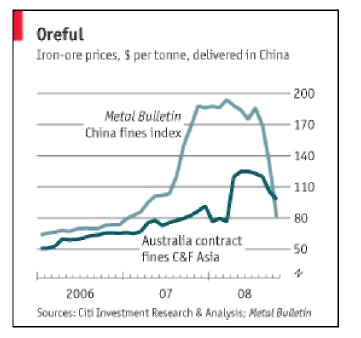
39 "From Gold to Lead," The Economist, 1 November 2008. The "China fines" index refers to Chinese spot - as opposed to contract - prices for iron ore.
40 Consumer Price Index data from the Bureau of Labor Statistics, US Department of Labor.
41 The Federal Highway Cost Composite Index includes costs for Excavation, Portland Cement, Bituminous Concrete, Reinforcing Steel, Structural Steel and Structural Concrete (source: Federal Highway Administration, "Price Trends for Federal-Aid Highway Construction"). TxDOT's Texas Highway Cost Index presents a similar picture.
42 Since the summer of 2008, the prices of many industrial commodities have declined sharply - many over 50 percent. Source: Bloomberg, London Metal Exchange.