2.4 Fuel Tax Unreliability in the Future
On balance, the evidence indicates that increasing and indexing the motor fuel tax remains a viable source of additional transportation funding, in the near term.
However, the recent steep run up and related steep run down in gasoline and diesel prices also points to issues that make a long term reliance on the motor fuel tax problematic. These include:
• A shift in consumer preferences to more fuel efficient vehicles;
• Likely federal policies to discourage carbon based fuel consumption
• Harder-to-tax alternate fuels replacing gasoline and diesel
• More stringent clean air requirements
The past two years have witnessed the fastest run up in energy prices since the oil shocks of the 1970s. Though prices have declined recently, real, inflation-adjusted prices in the summer of 2008 exceeded prior highs.
REAL VS. NOMINAL AVERAGE REGULAR GASOLINE PRICES 1949-200843
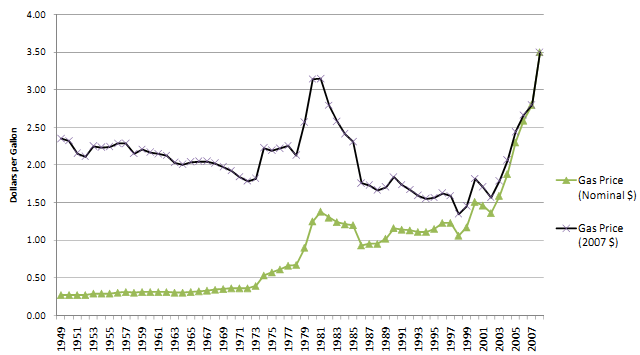
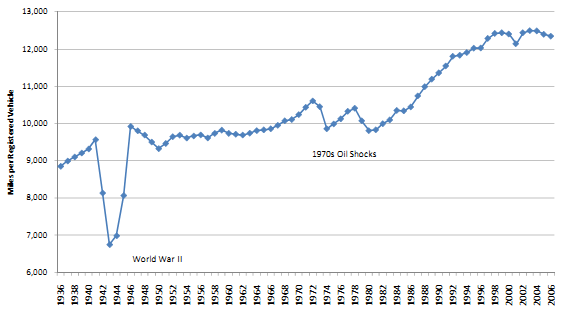
These price increases were all the more shocking to consumers since they followed a fifteen year period when fuel prices declined, in real terms, to postwar lows. The 1970s became a distant memory as consumers switched en masse from passenger cars to less fuel efficient trucks and SUVs. In addition, the period from 1985-2000 marked a significant increase in miles driven per vehicle.
MILES PER REGISTERED VEHICLE – USA 1936-200644
This trend is now reversing. Spot gasoline prices above $4 per gallon appear to have been the "tipping point" that compelled motorists to take action rather than merely grumble about high prices. The evidence to date is that consumers are reacting to today's high fuel prices the same way they did in the 1970s – initially by driving less –
AVERAGE DAILY VEHICLE-MILES TRAVELED (U.S. – BILLION MILES)45
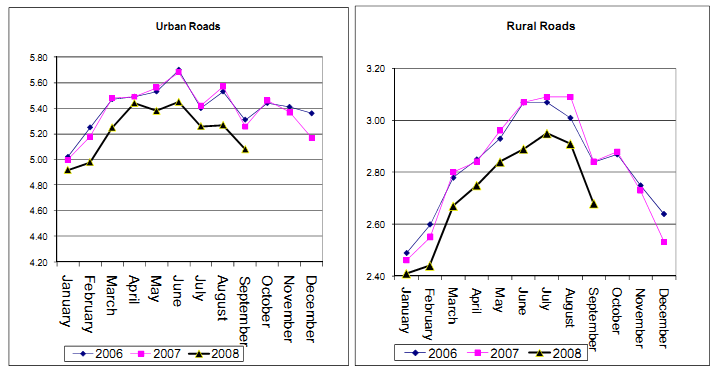
- and then over time switching to more fuel-efficient vehicles.
U.S. FUEL CONSUMPTION PER VEHICLE VS. REAL GASOLINE PRICE 1949-200646
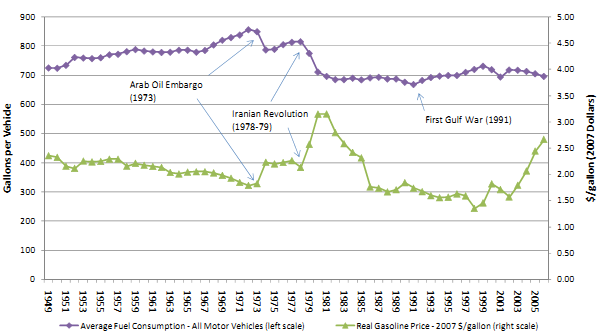
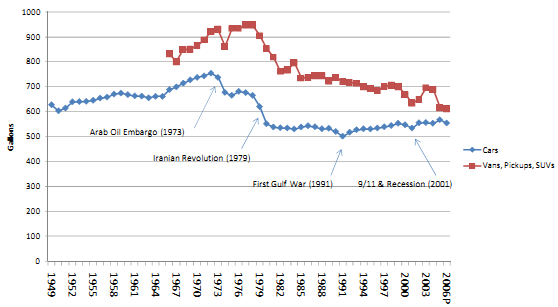
Increased fuel efficiency has negative implications for the long run viability of the motor fuels tax. In the decade from 1972 - the year before the first oil shock - to 1982, the average gallons of fuel consumed per vehicle in the U.S. fell by 20 percent. In the late summer of 2008, consumers responded in a similar way, as September 2008 sales of SUVs plummeted 47 percent and sales of pickups dropped 30 percent from their 2007 levels.47 We note, however, that the October-November 2008 drop in fuel prices has reignited consumer interest in large, less efficient vehicles.48
U.S. MOTOR FUEL CONSUMPTION PER VEHICLE 1949-200649
While a precise calculation of the cumulative impact of higher fuel prices is beyond the scope of this report, a 20 percent decrease in per-vehicle fuel consumption - all else being equal - would represent a loss of Fund 6 revenues of roughly $400 million per year - a figure equivalent to a four cent change in the fuel tax rate.
Federal policies going forward are likely also to reduce the demand for fuel on a per-vehicle basis, both for environmental and national security reasons. The 2007 energy bill increased Corporate Average Fuel Economy (CAFE) standards to 35 mpg by 2020. Other business and political leaders are proposing more radical solutions - the support for which tends to rise and fall with the price of fuel and international headlines.
Today's situation is likely to be different from the 1970s, though, in one critical respect: the vehicle replacement cycle will probably be longer - meaning that less efficient vehicles will remain on the road longer than they did in the 1970s.
First, today's cars are better made. In 1981, cars in the U.S. averaged 4.5 defects per vehicle. By 1995 that figure had declined to less than one.50 Quality is now less of a distinguishing characteristic for manufacturers than a requirement just to stay in the game. More consumers will hang on to their existing vehicles because they can.
Another, perhaps larger, group will do so because they have no choice. One of the consequences of the easy credit environment of the past few years is that a significant number of consumers are "upside down" on their auto loans - they owe more than their vehicle is worth. While there are no official figures, reasonable estimates have found that this number could be as high as 40 percent - up from 25 percent just five years ago.51 The plummeting resale values of "gas guzzlers" will only exacerbate this problem.
Finally, we must address the potential impact of alternate energy sources on Texas' current highway financing mechanisms. We raise three key points:
• Expert opinion regarding mass market availability of alternative vehicles differs widely
• Change, when it comes, could be relatively sudden
• Taxation policy will depend in large part on which alternative fuel is the "winner"
The first two points are beyond the scope of this narrative and are the subject of fierce debate within the automotive industry - with billions of dollars riding on the outcome.
The upshot to state policy makers - the ongoing viability of a fuel tax in an alternative fuel environment - will depend on the degree to which the successful technology resembles today's fuel distribution system. For instance, if hydrogen powered cars become the vehicles of the future, taxation could proceed in a manner similar to the existing motor fuel tax. Customers would refill their tanks at hydrogen service stations, and the state could simply compare the energy content of a cubic meter of hydrogen to that of a gallon of gasoline and set tax rates accordingly.
Electric vehicles, on the other hand, would require a more fundamental change. Though it would be possible to tax electricity usage, how would the state allocate - or even know - whether a particular kilowatt-hour was used to charge an electric car or to operate other household appliances? Electric vehicles would require an entirely new taxation approach.
_________________________________________________________________________________
43 Source: Energy Information Agency. Note that 2008 prices reflect the average for the year to date up to early
November, reflecting the high prices of the spring and summer.
44 Source: Federal Highway Administration Tables mv200; vm201; mv1 (1996-2006); vm2 (1996-2006)
45 Source: US Department of Transportation
46 Source: Energy Information Agency, Annual Energy Review - Energy Consumption by Sector, Table 2.8.
47 Source: The Wall Street Journal
48 Source: "Repeat Performance: Buyers Return for Pickups, SUVs; Lower Gas Prices and Bargains Lure Consumers to Dealers Creating a Headache for Auto Makers," Wall Street Journal, 3 November 2008.
49 Source: Energy Information Agency, Annual Energy Review - Energy Consumption by Sector, Table 2.8.
50 Source: McKinsey Quarterly
51 Source: Edmunds.com. This squares with anecdotal evidence from Dallas-area car dealers.