Australia
Unlike the other countries visited, nearly all highway PPP activity in Australia has occurred at the state or municipal level and primarily in three states: New South Wales, Victoria, and Queensland. PPP arrangements are under consideration at the national level for development and enhancement of the interstate motorway system, but projects have yet to be solicited.
NEW SOUTH WALES has more than 20,000 km (12,427 mi) of state roadways and regional and local roads. It entered into its first arrangement via an unsolicited proposal for the Sydney Harbour Tunnel, which opened for service in August 1992.2 Subsequently, the state has used seven additional PPP contracts to complete the orbital (perimeter or ring road) around Sydney, the most recent being three projects delivered in a 5-year period: the Cross City Tunnel, the M7 Motorway, and the Lane Cove Tunnel (see figure 5 on next page). In total, 108 km (67 mi) of state highway, or less than 1 percent of the total state network, are under PPP contracts.
VICTORIA has a network of more than 22,000 km (13,670 mi) of metropolitan and rural arterial roads, and only two highway PPP contracts. The first, a 22-km (14-mile) highway named CityLink, opened in 2000 to provide a north-south connection to Melbourne's central business district and airport. The second, a 40-km (25-mile) highway named EastLink, opened in 2008 to provide another north-south connection on the eastern fringe of Melbourne. Both are illustrated in figure 6 (see page 15). Combined, these arrangements are also less than 1 percent of the total state network.
QUEENSLAND has more than 33,500 km (20,816 mi) of state-controlled roads, but only two PPP contracts. The first, the North-South Bypass Tunnel, was an arrangement brokered by the Brisbane Municipal Council to provide another crossing of the Brisbane River. This 6.8-km (4.2-mi) tunnel is under construction. The second is a state project, AirportLink/Northern Busway (illustrated in figure 7), a multifaceted $4.6 billion connection between downtown Brisbane and the airport. The preferred bidder was selected in May 2008 and financial close was achieved in July.
Table 2. Future transportation investments in Spain: budgetary versus non budgetary.
| Mode | Budgetary | Nonbudgetary | Percent of Total |
| Roads | 75.0% | 25.0% | 26.8% |
| Railways | 81.4% | 18.6% | 48.0% |
| Airports | 2.2% | 97.8% | 6.5% |
| Ports | 9.7% | 90.3% | 9.7% |
| Other | 27.7% | 72.3% | 9.0% |
| Percentage of Total | 59.5% | 40.5% | 100% |
Investment in the 4 modes of transport:
Ministry of Fomento of Spain Period 1995-07
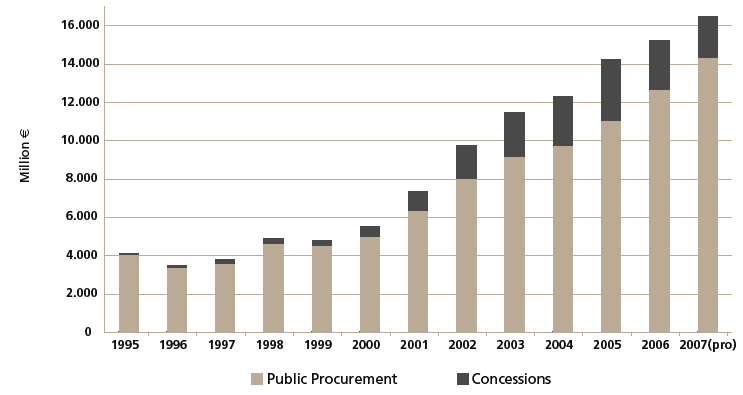
Figure 3. Spain’s national investment in transport infrastructure, 1995-2007:
public investments (budgetary) and concessions (nonbudgetary).
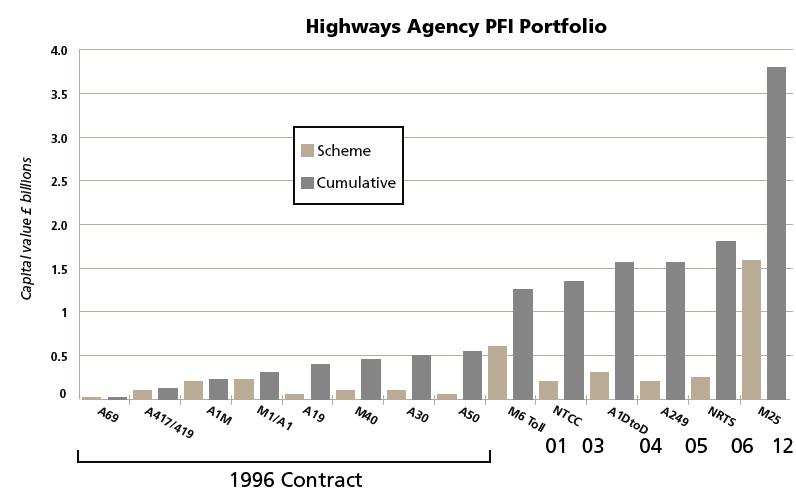
Figure 4. Highways Agency PFI portfolio, 1996 to date.
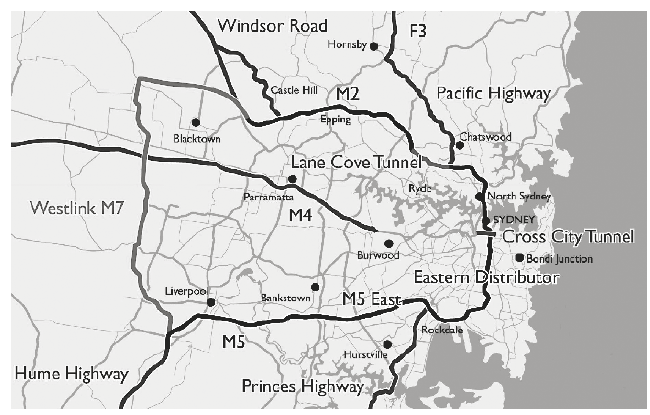
Figure 5. Sydney’s orbital roadways.
____________________________________________________________________________________
2 No other unsolicited highway proposals have been developed in Australia.