AGENCY READINESS FOR PPPs
The readiness of state and local transportation agencies to use PPP approaches to transportation project delivery can be inferred by several factors, including having the legal authority to use PPPs, institutional willingness to use design-build project delivery, and participation in various direct user charge initiatives under the FHWA's Value Pricing Pilot Program (VPPP). These factors are important indicators of PPP potential, especially for private provider teams that want assurance that the legal and institutional framework exists to enable the use of PPPs for transportation projects. States where several or all of these factors currently exist are the most likely to consider PPPs to develop needed transportation projects.
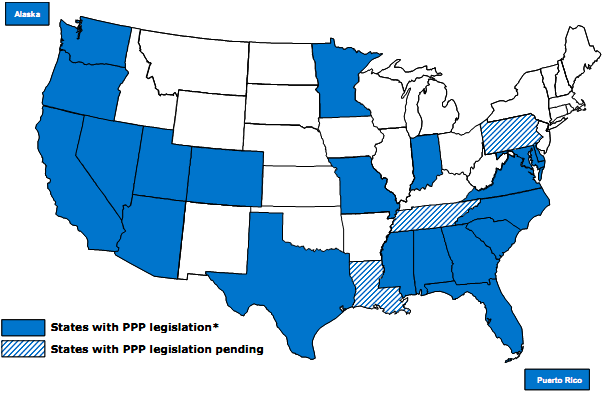
The following three exhibits show the states with legal authority to use PPPs for transportation projects, have the authority to use design-build project delivery, and have value pricing projects either operating or planned under FHWA's VPPP. Exhibit 14 shows the 21 states and Puerto Rico with current PPP legislation for transportation projects, plus three additional states with pending legislation. A number of other states are also considering possible legislative action to allow the use of PPPs for transportation projects, including New York, New Jersey, and Hawaii.
Exhibit 14 - States with Legal Authority to Use PPPs for Transportation Projects
|
* Arizona and California PPP Authority limited to several pilot projects in certain cases. Source: Nossaman Guthner Knoz & Elliott. Data valid through April 2007 |
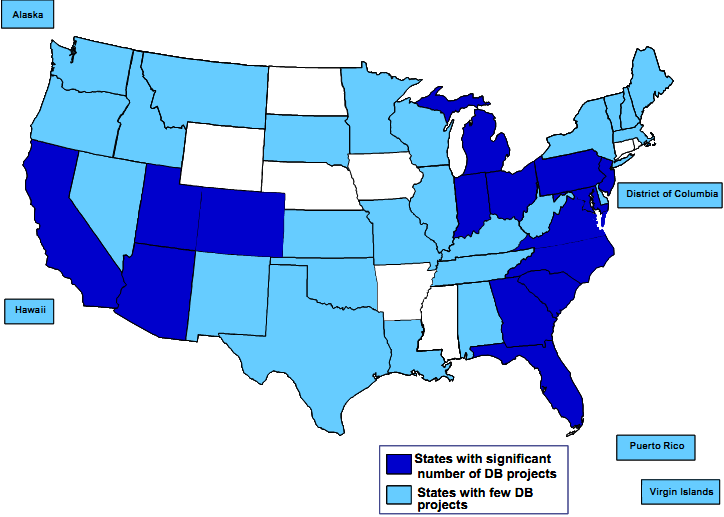
Most states provide legislative authority to their transportation agencies to use the design-build PPP approach to delivery various types of projects. Exhibit 15 shows that forty-two states, the District of Columbia, Puerto Rico, and the Virgin Islands have the ability to deliver transportation projects using the DB project delivery approach. Fifteen of these states have or currently make extensive use of the DB approach to expedite projects and control costs by passing much of the project risk for project engineering and construction to the DB team.
The significance of having DB authority is that most private members of PPPs desire the features design-build provides the project to help control costs and delivery schedules by integrating the design and construction functions. This helps them better manage project risks by ensuring that constructible design plans are completed before construction begins and that the construction efforts comply with the performance-based specifications contained in the plans. Therefore states with DB capability and experience are considered more likely to develop PPP arrangements and have contract administration capability needed for a successful PPP project.
Exhibit 15 - States with Design-Build Project Delivery Authority
|
* California - Transit agencies and certain cities and counties Illinois - Regional Transportation Authorities Massachusetts - authorized on a project-specific basis Texas - Comprehensive Development Agreements Source: Design-Build Institute of America, April 2007. http://www.dbia.org/ |
Another positive indicator of PPP interest and capability is a state's active participation in FHWA's Value Pricing Pilot Program, which promotes the use of innovative ways to reduce congestion while generating additional funds for transportation infrastructure programs. In seeking ways to reduce traffic congestion, VPPP projects will also improve safety, reduce emissions, and lower fuel consumption.
Each year project applications are sent to FHWA for review and certain projects are approved for VPPP grants. In 2005, fourteen states had eleven operating projects and seventeen projects under development, as shown in Exhibit 16 on the next page. Since then, thirty-nine additional projects that have been designated for VPPP grant funds, with the State of Pennsylvania joining the ranks of states shown in Exhibit 16 with VPPP-approved project grants. This brings the total approved VPPP grant applications for projects to sixty-seven as of March 2007. This means greater experience and exposure for operating and pricing strategies that can facilitate future PPPs.5
As of April 2007, the Value Pricing Pilot Program included the following types of projects, listed in order of number of grants approved:
• Variable pricing on new highway lanes and bridges - 20 projects
• Variable pricing of existing tolled facilities - 14 projects
• Conversion of HOV lanes to HOT lanes - 8 projects
• Regional pricing networks - 9 projects
• Usage-based vehicle charging - 8 projects
• Cash-out strategies for those electing to use alternatives to the single-occupant automobile - 3 project
• Parking pricing - 2 projects
• Cordon area tolling - 2 projects
• Truck-only toll facilities - 1 project
Participation in VPPP projects demonstrates a willingness of the state to embrace innovative methods to generate additional program revenues and reduce congestion. States most active in the program include the following five states, which have a combined forty-five approved VPPP projects, representing sixty-seven percent of the total projects approved by April 2007:
• California - 14 projects
• Florida - 10 projects
• Texas - 10 projects
• Minnesota - 6 projects
• Washington State - 5 projects
Exhibit 16 - States Participating in FHWA's Value Pricing Pilot Program in 2005
|
|
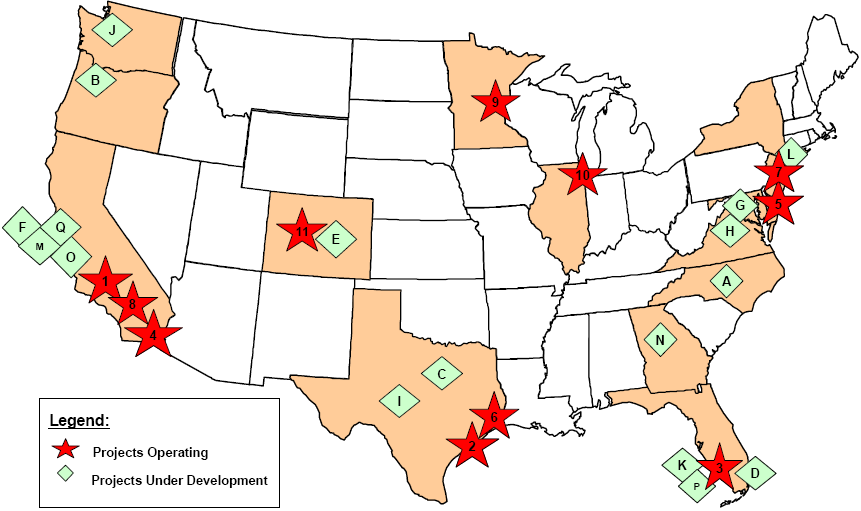
| Operating Projects | Projects Under Development |
| 1. Express Lanes on SR-91 (Orange County, CA) 2. HOT Lanes on I-10 (Houston, TX) 3. Variable pricing (Lee County, FL bridges) 4. HOT Lanes on I-15 (San Diego, CA) (HOT 5. Variable tolls (New Jersey Turnpike, NJ) 6. HOT Lanes on US 290 (Houston, TX) 7. Variable tolls (Port Authority Interstate 8. Peak pricing on the San Joaquin Hills Toll Road (Orange County, CA) 9. HOT Lanes on I-394 (Minneapolis, MN) 10. Variable tolls (Illinois Tollway System) 11. HOT Lanes on I-25/US 36 (Denver, CO) | A - HOT Lanes on I-40 (North Carolina) B - HOT Lanes on 217 (Portland, OR) C - HOT Lanes on LBJ Freeway (Dallas, TX) D - HOT Lanes on I-95 (Miami, FL) E - HOT Lanes on C-470 (Denver, CO) F - HOT Lanes on I-580 and I-680 (Alameda Co., CA) G - HOT Lanes on I-495 (Virginia/Maryland) H - HOT Lanes on I-95 and I-395 (Virginia) I - HOT Lanes on Loop 1 - MOPAC (Austin, TX) J - HOT Lanes on SR 167 (Seattle, WA) K - Cordon tolling (Fort Myers Beach, FL) L - Cordon tolling in central New York City (NY) M - FAIR Lanes (Alameda County, CA) N - HOT Lanes/FAIR Lanes/Truck-Only Toll Lanes O - HOT Lanes in Median of Route 1 (Santa Cruz, CA) P - Q-Jumps (Lee County, FL) Q - Cordon tolling (San Francisco, CA) |
Source: Issues and Options for Increasing the Use of Tolling and Pricing to Finance Transportation Improvements, AECOM Consult study for FHWA's Office of Transportation Policy Studies, June 2006
_________________________________________________________________________
5 Sources: http://www.ops.fhwa.dot.gov/tolling pricing/value pricing/quarterlyreport/qtr1rpt07/index.htm and http://www.fhwa.dot.gov/pressroom/fhwa0703.htm