USE OF PPPs FOR U.S. ROAD-RELATED PROJECTS
Between 1985 and 2004, there were 62 PPP road projects planned and funded in the United States representing $42 billion. Exhibit 37 shows the distribution of PPP road-related projects by facility type over that 20-year period. Exhibit 38 shows the distribution of PPP road-related projects by contract approach over the same 20-year period.
The key results shown in Exhibits 37 and 38 on the next page are listed below:
• Most of the U.S. road projects were for toll and non-toll highways, representing 44 percent and 39 percent of the total number of projects, respectively.
• In terms of project costs, the largest type of PPP road project was toll highway, representing 62 percent of total cost.
• Non-toll highway projects accounted for only 19 percent of total cost, since toll highway projects are often much larger than their non-toll highway counterparts.
• At just over $900 million each, toll highway projects were about three times the cost of non-toll highway projects in the PPP project database
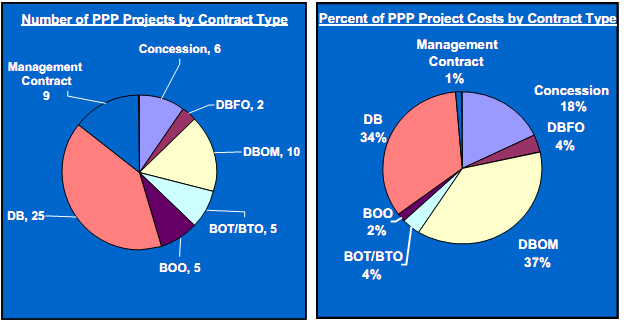
• Most of the U.S. road projects involved DB and DBOM contracts with DB the largest contract type at 40 percent of the projects and 34 percent of the costs. These PPP contracts included both toll highway and non-toll highway projects.
• While DBOM projects represented only 16 percent of the total number of PPP projects planned and funded in the U.S., they amounted to 37 percent of the total costs. This was because DBOM projects, at $1.6 billion each, are about three times the size of their DB counterparts, with contract terms of up to 20-30 years.
• The third most frequently used contracting method was Management Contract at 15 percent. These were relatively small non-toll highway projects in terms of cost, which was reflected by the small percentage (1 percent) of total costs accounted for by Management Contract projects, whose terms were typically from 5-7 years.
• While there were fewer Concession and DBFO contracts in the U.S., their average cost was significantly higher than their DB counterparts, particularly Concession contracts at about $1.3 billion each.
Globally, the United States has had the vast majority of the DB and Management Contract road projects. While not extensively used in any region, BOO was also used more in the U.S. than elsewhere, particularly for small projects involving toll bridges.
Exhibit 37 - U.S. Road, Bridge, and Tunnel PPPs by Facility Type14
(62 Planned & Funded Projects in the U.S. worth $42 Billion between 1985-2004)
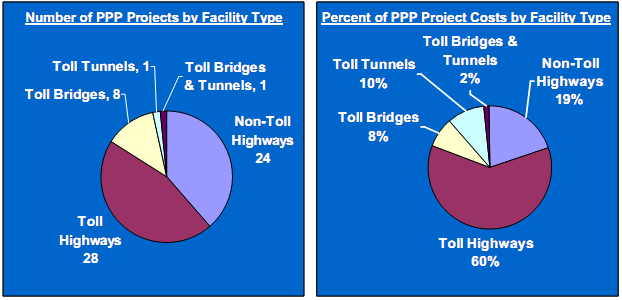
Exhibit 38 - U.S. Road, Bridge, and Tunnel PPPs by Contract Type15
(62 Planned & Funded Projects in the U.S. worth $42 Billion between 1985-2004)
The growth in PPPs in the U.S. is most evident in the past 2 years, when:
• 58 PPP road projects were planned or funded, versus 42 projects in the prior 20 years; and
• $54.3 billion in PPP road projects were planned and/or funded, versus $42.2 billion in PPP road projects during the entire prior 20 years.
Other evidence of the growth of PPP projects is found in increased number of proposed toll projects, currently totally 58 toll projects valued at $85 billion. This compares to only 16 toll projects valued at $19 billion just two years ago. Most of these toll road projects are structured as concession arrangements, while other are proposed simply as design-build projects.16
____________________________________________________________________________________
14 AECOM Consult, Inc. "Synthesis of Public-Private Partnership Projects for Roads, Bridges & Tunnels from Around the World - 1985-2004", prepared at the request of the Federal Highway Administration, August 30, 2005.
15 AECOM Consult, Inc. "Synthesis of Public-Private Partnership Projects for Roads, Bridges & Tunnels from Around the World - 1985-2004", prepared at the request of the Federal Highway Administration, August 30, 2005.
16 Public Works Financing Newsletter, Volume 209, October 2006, p. 4.