4 PERFORMANCE INDICATORS
When it comes to "Performance indicators" terminology is quite confusing as so many different countries are using different names and there is no common standard. Some countries use terminology such as Performance Indicators (PI), "Key Performance indicators" (KPI), asset level indicators, strategic level indicators, and the list goes on. It really depends upon which administration level of "Performance Indicators" is being referred. It is intended that the following information will attempt to clarify the meaning of "Performance Indicators" and demonstrate how they are referred to in this study.
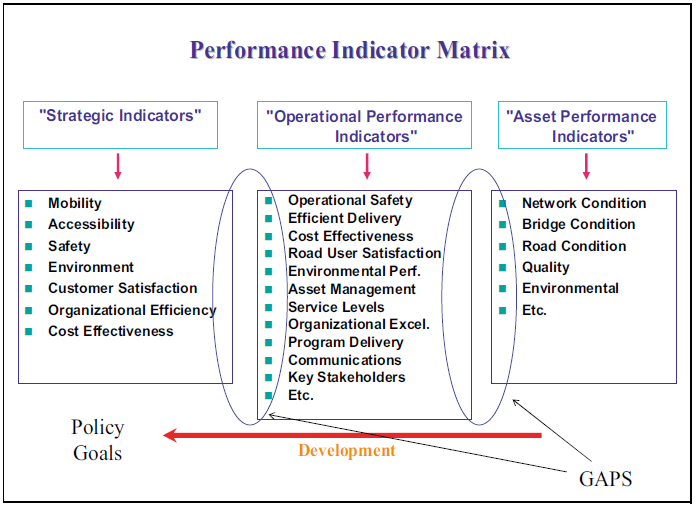
The following set of explanations and visual aids will attempt to show some logic and reason behind the schemes when discussing indicators. When discussing issues at the highest level of government, usually the Ministry of Transport or Department of Transportation, the "Performance Indicators" are defined as those measures at the highest level or "Strategic Indicators". These are usually aligned to society goals, road user concerns, political, and some-times key stakeholder demands. This strategic level usually includes mobility, accessibility, safety, environment, customer satisfaction, cost effectiveness, organizational excellence, and even security is being added due to global terrorism. The term used in this study to describe these PI is being termed as "Strategic Indicators". Many countries are already using these measures and they usually include an objective, outcome, and a target level. Obviously, these "Strategic Indicators" need to be measured objectively or in some logical manner. It takes time to develop these and requires a few years of practice in order to determine if the "Strategic Indicators" have been achieved or not.
Usually, the next level of government or responsibility for the roads is the road authority or road administration. Some of the potential indicators for the road authority might be operational safety, efficient delivery of services, cost effectiveness or accountability, road user satisfaction, environmental consideration, quality or service levels, organizational excellence, program delivery, communications, and key stakeholder relationships. These indicators are called "Operational Performance Indicators" (OPI).
Then the next level down could be termed as "Asset Performance Indicators" (API), which measures the asset condition of the various road assets. Usually the road authority manages the data collection and many even have a condition assessment report that describes the status of the assets at that period in time. For example: network condition, bridge condition, road condition, quality, and environmental
However, as time goes forward the asset condition can change and is important to determine the deterioration of the assets so that there is intervention before any particular asset fails. This data is also important to demonstrate the budget needs and requirements and how the asset condition is affected.
These different levels of indicators are shown in Figures 18 and 19 which attempt to describe the relationship between the different indicators. Some indicators like environment, safety, and customer service tend to be common at all levels and there is a strong correlation of these measures from the lower to the strategic level indicators. Also, many measures have no commonality between them and it is significant to notice that there are "missing gaps".
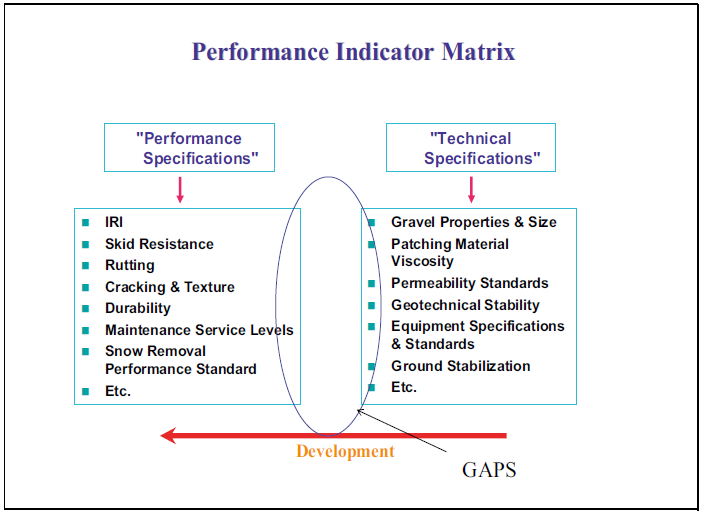
One objective of this study was to determine if any "Strategic Indicators" were used in the contracts for either capital projects or maintenance contracts. The results of the international study reveal that there are some missing gaps between these higher-level performance measures and those performance measures that are used in the contracts. None of these so called "Strategic Indicators" were used in contracts, as it is difficult for any service provider to meet them, nevertheless it is important to understand the meaning, and all the details included. However, these "Strategic Indicators" are incorporated or attempted to incorporate the translation of these measures into understandable technical and performance requirements. These requirements or standards are what are typically used in the actual contracts. These are at a lower level than Strategic Indicators, OPIs', and APIs accordingly.
|
|
|
| Figure 18 Performance Indicator Measures | |
|
| |
| Figure 19 Performance & Technical Standards |

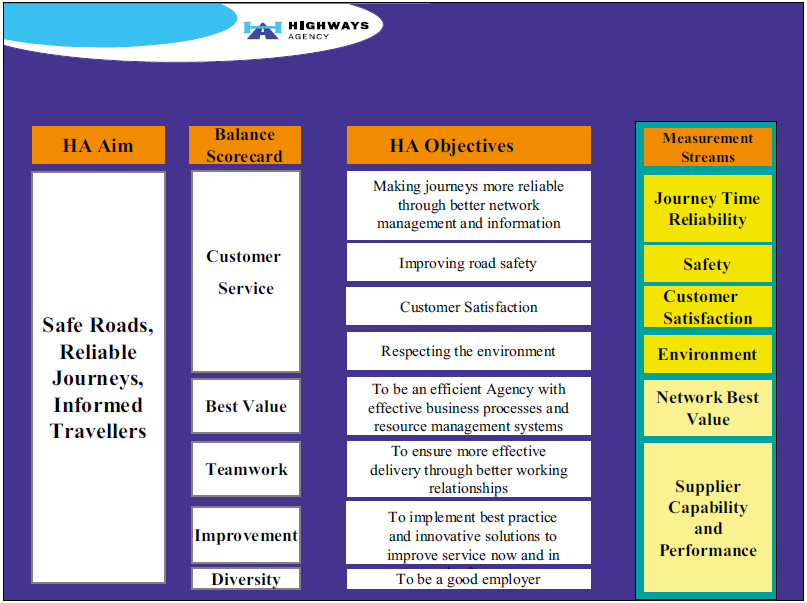
It might be easier to understand the continuity of Performance Indicators and measures from another example from the Highways Agency in England. See Figure 20 which shows a correlation between many aspects of Highways Agency (HA) aims, Balanced ScoreCard (BSC), HA objectives, and Measurement streams.
Highways Agency (2006) has more details on how these measures can be utilized and the management plan in Highways Agency (2006) includes information on how the process has been developed through the accountability aspects within the entire organization. It should also be noted that the Balanced ScoreCard (BSC) is being used. Some countries are further ahead in the development and use of Performance Indicators and many of them utilize the BSC in some manner. Others are using a red, yellow and green light system for easy identification of the poor, good, and neutral parameters, from the BSC framework. This type of system is a nice and simplified system and can be easily understood by road users too. Although it is a more simplified system, it is able to follow the performance of many important aspects that are identified by measures and targets.
Source: Highways Agency
Figure 20 Highways Agency Performance Measures
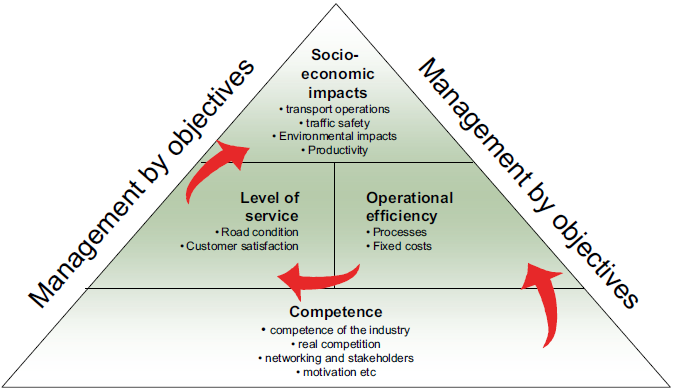
In Finland the "Management Triangle" concept is used at both the road authority and also at the transport ministry level. This is similar to the Balanced ScoreCard (BSC) concept except that it is in a triangle form. The impacts to society and the customer service levels are the external performance criteria and the internal aspects are the operational efficiency and competence of the organization in order to achieve the requirements set out in the management by objectives. Refer to Figure 21 for visual representation of the "Management Triangle".
These are some examples in which "Performance Indicators" are used in road authority organizations. It is more of a management and administrative so that there is an objective system to measure the performance and accountability of governmental organizations. Even though these performance measures cannot be directly transferred into the maintenance and construction contracts there is some form of benchmarking to indicate the status and performance of key objectives.
The previous examples show that both England and Finland have made a move to connect the various levels of performance indicators with each other and also that a number of missing gaps remain. It is important to note that there are also other countries that are using these or similar systems. Mapping the links between the levels and pointing out how these links could be strengthened in theory is only a first step. In order to actually implement these connections, filling in the gaps, organizing work processes along these lines and ensuring that monitoring and feedback loops will require a lot more intellectual and organizational effort. At the time of writing, the capacity for such an undertaking was not available, leaving the question whether devising a well-functioning performance evaluation system will be achieved.
| Management Triangle |
|
|
Source: Finnra & MOTC
Figure 21 Management Triangle
Some of the main benefits for the use of these types of systems or indicators can be summarized as follows:
• Good internal benchmark of organizational performance
• Good benchmark on road network performance
• Accountability throughout the organization
• Determining the overall understanding of performance against targets
• Budget can be objectively related to actual conditions
• Potential for budget to drive the needs and correct deficiencies
Some of the weaknesses with this type of systems or indicators can be summarized as follows:
• Cannot be used as a benchmark against other countries systems
• Difficult to determine what aspects and why things improved or deteriorated
• Need several years of data to determine any trends, shortfalls, & results Conclusions;
• Countries basically having differing indicators and systems
• Feedback loop is desired
• Accountability throughout the organization
• Still needs further development