Appendix Three National Audit Office estimate of potential savings the Agency could have achieved by implementing hard shoulder running
1 We used the same methodology and financial model that the Agency used to assess the value for money of the M25 project. We made low and high estimates of savings in net present cost to produce a range of values (Figure 11).
_____________________________________________________________________________________________
Figure 11 Potential present value of savings against the private finance solution
| Agency's original estimate of conventional widening project | Scenario with operation and maintenance cost in line with the Agency's estimates1 | Scenario with operation and maintenance cost in line with the private Finance bidders2 | ||
Capital savings from hard shoulder running | 0% | 40% | 60%3 | 40% | 60%3 |
| (£bn) | (£bn) | (£bn) | (£bn) | (£bn) |
Capital Cost4 | 1. 2 | 0.8 | 0.5 | 0.8 | 0.5 |
Operation and maintenance cost | 2.0 | 2.0 | 2.0 | 1.6 | 1.6 |
Other items | 0.2 | 0.2 | 0.2 | 0.2 | 0.2 |
Total | 3.4 | 3.0 | 2.7 | 2.6 | 2.3 |
Signed private finance contract | 3.4 | 3.4 | 3.4 | 3.4 | 3.4 |
National Audit Office Savings estimate | 0.0 | 0.4 | 0.7 | 0.8 | 1.1 |
NOTES
1 Based on the Agency's low estimate of operation and maintenance cost.
2 While maintenance savings based on greater efficiencies are included in our calculations we have not included possible further maintenance savings from hard shoulder running compared with widening. This is because of uncertainties over such savings.
3 The Agency considers 60 per cent savings would be dependent on a large programme of widening rather than a single project.
4 A small proportion of capital cost is not subject to the percentage savings.
5 The figures are expressed in 2007 prices using a discount rate of 3.5 per cent.
6 The Agency had proved in its M42 trial that hard shoulder running at 60 miles per hour would deliver 80 per cent of the benefits of widening. The benefits from using this technique on the M25 would need further evaluation.
Source: National Audit Office
_____________________________________________________________________________________________
2 The high savings scenarios have been presented graphically in Figure 12.
_____________________________________________________________________________________________
Figure 12 Graphical representation comparing our estimates of a conventionally funded hard shoulder running contract against the Connect Plus contract price
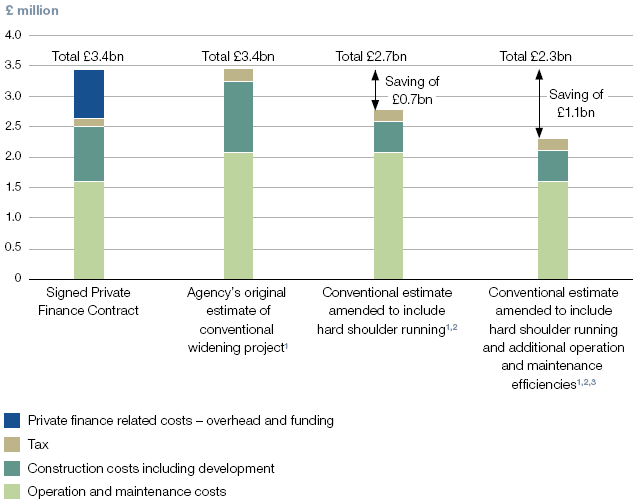
NOTES
1 Based on the Agency's low operation and maintenance cost estimate.
2 Assumes 60 per cent capital savings.
3 Assumes operation and maintenance efficiencies the same as private finance bidders.
4 2007 prices using a discount rate of 3.5 per cent.
Source: National Audit Office
_____________________________________________________________________________________________