The costs of the contract
1.2 The 2004 NAO report found that the Department secured a competitive price from Mapeley, but that good risk management would be essential as Mapeley was a new company entering the market, and had put in a low bid to establish itself. It based its bid on speculative returns from increases in property values over the 20 years, and expected minimal operating profits. The Mapeley bid was some £500 million (2001 net present value) cheaper over the life of the contract than other bids, and some £300 million cheaper than the Public Sector Comparator, the Department's estimate of how much it would cost to continue managing the estate itself.
1.3 Mapeley's bid was £3.19 billion in 2009 prices.1, 2 Following further negotiations on the accepted bid, Mapeley prepared a revised financial model which was included in the contract. This estimated the total cost at £3.3 billion (2009 prices). The increase was due to the inclusion of an additional 16 buildings and five service-only properties, and changes to Mapeley's debt structure. The first year cost increased by £30 million (2001 prices) to £181 million: £6 million for additional buildings, £17 million for debt costs, and £7 million for maintenance work found to be the Department's responsibility following surveys. The debt costs relate to the loan Mapeley took for the initial investment. The original debt structure assumed no charges in the first two years. Although the Department paid more in debt costs in the early years of the contract, overall it benefits from the change.
1.4 In 2008-09 the Department paid Mapeley £206 million for rent, facilities management, estate maintenance, and debt charges (Figure 3). This includes a proportion recharged to the Valuation Office Agency and other occupiers. £157 million related to estate occupied by the Department, representing about 35 per cent of its total estate costs of £450 million. By the end of 2008-09 the total cost was £1.88 billion (2009 prices), £312 million (20 per cent) more than the contract model price. Figure 4 overleaf shows the reasons for the increase.
1.5 In addition to the payments made, Mapeley has lodged a £12 million claim for a number of services for which it had not previously invoiced the Department, dating back to December 2002. The Department is negotiating the amount it will pay.
1.6 While the Department has paid more for the contract than modelled, the NAO's 2007 report, Improving the efficiency of central government's office property, found that the Department's office costs were at the lower end of the range for 16 Government departments. Its cost was £157 per square metre in 2005-06, whereas the range was £123 to £636 per square metre.3 The STEPS estate also cost £157 per square metre in 2005-06. In 2008-09 the STEPS estate cost around £160 per square metre. The cost reflects the reduced contractual payments arising from the transfer of the freehold properties (Figure 2) and the Department's presence in regions where accommodation costs are lower.
1.7 The Department has not had strong processes to monitor the overall cost of the contract and whether it is achieving value for money. It calculates the expected cost annually and checks monthly invoices, but does not compare figures against initial models. In June 2009 it estimated that over the contract it will pay Mapeley £3.87 billion in 2009 prices. The final cost will depend on how much space the Department vacates (Part 2).
Figure 3 |
|
Source: National Audit Office analysis of Departmental information |
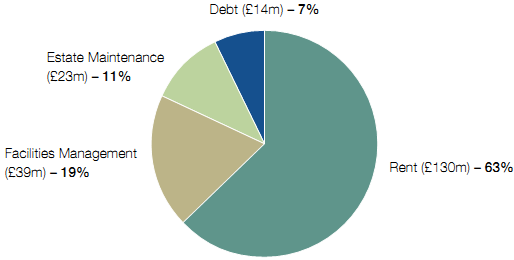
Figure 4 | ||
Reason | Total cost incurred (2009 prices) (£m) | Explanation |
VAT indemnity | 138 | Under the contract the Department pays an indemnity for the VAT Mapeley pays to landlords but cannot recover on leases which are virtually assigned as described in Part 3. The Department would have had to pay these costs whichever bidder won the contract, and it did not include them in its comparison of bids or in its assessment against the Public Sector Comparator. |
Additional buildings | 40 | The Department has paid for 11 additional buildings between 2003 and 2005, and 10 since then, although it has not formally incorporated these buildings into the contract. |
Additional payments | 40 | In 2005 the Department agreed an extra annual charge of £4 million (2001 prices) up-rated each year, relating to specification errors in original information and changes to service requirements. |
Modelled price increases | 22 | The contract increases the price annually by the Retail Price Index, a normal pricing mechanism in such deals. The model assumed standard annual inflation of two per cent, but on average inflation has been higher over the eight years of the contract. However, it is less than zero for 2009-10. |
Use of vacation allowances | 72 | The model assumed the Department would use vacation allowances more extensively than it has done to date (Part 2). |
Total | 312 |
|
Source: National Audit Office analysis of Departmental information | ||
________________________________________________________________________________
1 Previous NAO and PAC reports quoted net present cost of £1.50 billion in 2001 prices.
2 All figures expressed in 2009 prices are adjusted using March RPI figures from 2001-2009, and future cash flows are discounted at 3.5 per cent.
3 HC 8 Session 2007-08, November 2007. These costs were the mid-value when the cost per square metre for each building was ranked in order.