First pass
The Unitary Charge in the Model as shipped is based on a figure of £14,037,123 pa, split between an availability fee of £10,603,346 pa and a service fee of £3,433,777 pa. This figure is subject to inflation, and revision under the Performance Measurement regime or through the result of periodic soft service market testing exercises.
Assuming that this figure is held constant, increasing the margin on the bond will cause all the ratios reported by the model to worsen. The project's revenues do not vary, nor do its operating and capital costs. But of its operating cash flows, a higher proportion is required to service the bond, making the ratio between the two narrower. This effect is mitigated, but not eliminated or reversed, by the reduction in tax payments that results from the higher interest charge.
We have calculated how much the Unitary Charge needs to be increased in order to offset these effects, and to hold the four principal ratios we identified earlier constant:
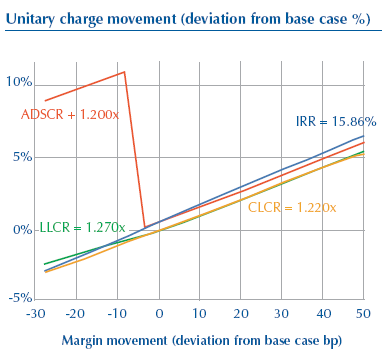
■ The blue line in the graph below shows what change in the Unitary Charge is required to hold the equity IRR at its minimum required value of 15.86% as the bond margin is altered;
■ The green line does the same for the senior LLCR, which is held at its minimum value of 1.270x;
■ The red line does the same for the senior ADSCR, held at its minimum value of 1.200x; and
■ The orange line does the same for the total debt CLCR. It is held at its base case value of 1.220x.
The contours on a land map connect points of equal height, and the isobars on a weather map connect points of equal atmospheric pressure. The lines on this graph are similar, because all the points along them have the same IRR, LLCR, ADSCR or CLCR.
The lines cross, indicating which of the four ratios is actually responsible for determining pricing varies depending on the bond margin. Whichever of the lines is uppermost, at any given bond margin, determines the change in Unitary Charge needed to preserve the ratios. This analysis considers four ratios, and as the graph shows, the iso-IRR, iso-LLCR and iso-CLCR traces move roughly linearly with the movements in bond margin. The equivalent for ADSCR does so too, with the exception of a dog leg occurring when the margin falls just lower than the base case.
The ADSCR trace shows the minimum of a series of numbers. Very small changes to the overall cash flows can cause the period that contributes the lowest ratio to jump from one period to another, taxation effects usually being the prime suspect for causing such jumps. The kink in the graph represents just such a jump from one period to another.
The impression that the pricing needs to be significantly changed to preserve a particular minimum ADSCR can be discounted. In practice a rational bidder would sculpt the debt repayments, as necessary, for a particular combination of financing plan and Unitary Charge to stop the minimum ADSCR from ever being unpalatable to the lenders. In essence the iso-ADSCR trace can be manipulated to give a shape similar to the iso-LLCR.
It can be seen that the iso-IRR trace is uppermost in most cases, the implication that the other three ratios shown here are subordinate to it. Very small changes in the assumptions or the structure of the Transaction could cause determination of the Unitary Charge to fall on any of the other ratios.