There are systemic performance differences between PFI and public prisons
2.16 From the prisons examined in our study, PFI prisons on the whole perform better than public prisons in areas related to the Prison Service's decency agenda, such as respect shown to prisoners. However, they generally perform less well in areas such as safety and security. It appears to be difficult for any prison19, whether private or public, to perform well in both of these areas which suggests there is a difficult balance to be struck between the two.
12 |
| Age Profiles in PFI and public sector prisons |
|
|
|
|
| Source: National Audit Office |
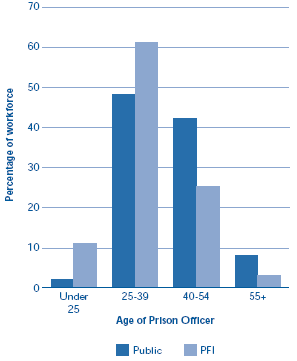
2.17 We found fundamental differences between the private and public sector in the deployment of staff and in the make up of staff teams in terms of experience, sex and age. Prison Custody Officers (PCOs) in PFI prisons tend to have little or no prior experience of working in prisons and have generally been in their post for much less time than their equivalents in the public sector. There are more women in PCO positions and the staff tends to be younger (Figures 11 and 12). Contractors argued that the development of new staff teams helps to create a positive culture towards prisoners. They also considered that their staff could be used more flexibly, allowing more efficient ways of working. Senior managers in the Prison Service told us that the relative inexperience of staff in PFI prisons had the potential to contribute to security problems if staff were not managed closely.
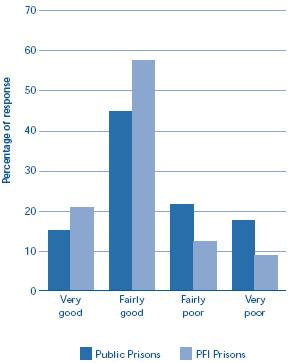
2.18 We commissioned MORI to carry out a survey of randomly selected prisoners from the prisons in our study, including all the PFI prisons. Our analysis of the results showed that for certain questions there was a statistically significant difference between the responses of prisoners in PFI prisons and those held in public prisons. For example, prisoners held in PFI prisons felt that they are shown greater respect and are treated better than prisoners in public prisons (Figure 13). These findings are broadly supported by research by the Institute of Criminology (Cambridge University), which has attempted to measure the quality of prison life in individual prisons.20
13 |
| Prisoners' views on the respect shown towards them by staff |
|
|
|
|
| NOTE Figures calculated as a % of Survey size: Public 1073 PFI 761 Analysis: Significantly different, tested at the 5% level, using the two-sample Wilcoxon rank sum test. Source: National Audit Office |
2.19 Other evidence also suggests that PFI prisons do not perform as well on safety. For example, there are relatively high levels of assaults in PFI prisons. Five of the seven PFI prisons had assault rates in the upper quartile for their category of prison in 2001/02 (Figure 14)21. In our qualitative interviews, prisoners also expressed concerns about safety issues related to the relative inexperience of staff in private prisons. They included fears about the conditioning of staff by prisoners and the ability of staff in private prisons to challenge prisoners' behaviour. However, escape data are broadly comparable between PFI and public prisons (Figure 15).
14 |
| Assaults as a % of prison population compared against the upper quartile for that prison's function | ||
|
|
|
| |
|
| PFI Prison | assaults % of population | Upper quartile assaults(function) |
|
| Ashfield | 74.1% | 70.3% |
|
| Dovegate | 4.5%* | 4.2% |
|
| Rye Hill | 4.9% | 4.2% |
|
| Forest Bank | 11.9% | 11.2% |
|
| Lowdham Grange | 1.0% | 4.2% |
|
| Altcourse | 13.2% | 11.2% |
|
| Parc | 9.0% | 11.2% |
|
| Red indicates that the Prison falls into the worse performing quartile for assaults when compared with prisons of the same function. This is the methodology applied for awarding a red indicator in our traffic light matrix. * Dovegate did not open until July 2001 and so this figure is based on July01-Mar02 data Source: Her Majesty's Prison Service | ||
15 |
| Escapes from PFI and Public Prisons |
| ||
|
|
|
|
| |
|
|
| PFI prisons |
| |
|
| Year | Escapes | Average Population | Rate per 1000 |
|
| 1997-98 | 0 | 360 | 0.00 |
|
| 1998-99 | 1 | 1919 | 0.52 |
|
| 1999-00 | 1 | 2261 | 0.44 |
|
| 2000-01 | 0 | 3212 | 0.00 |
|
| 2001-02 | 4 | 4418 | 0.91 |
|
|
|
|
|
|
|
|
| Public prisons (excluding open)* |
| |
|
| Year | Escapes | Average Population | Rate per 1000 |
|
| 1997-98 | 32 | 55681 | 0.57 |
|
| 1998-99 | 34 | 56954 | 0.60 |
|
| 1999-00 | 37 | 56613 | 0.65 |
|
| 2000-01 | 19 | 55853 | 0.34 |
|
| 2001-02 | 20 | 58161 | 0.34 |
|
| * Excludes PFI and privately managed prisons Source: Her Majesty's Prison Service | |||
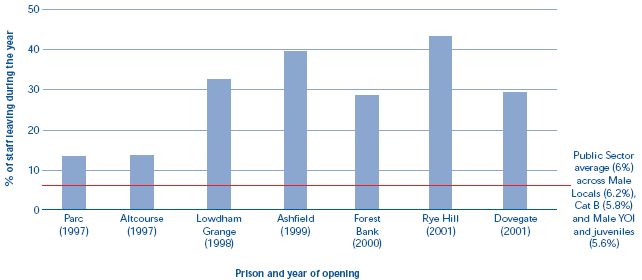
2.20 There is a very high turnover of staff in most private prisons and in each case turnover was higher than the public sector (Figure 16). Turnover is particularly high in private prisons that have opened recently, reflecting the fact that many new recruits have no previous experience of prisons. In those PFI prisons where we have figures for earlier years, turnover seems to decrease over time. However, PCOs are paid lower salaries than their equivalents in the public sector (see Figure 17) and this is likely to be a factor in the high levels of turnover, particularly in areas of relatively low unemployment.
2.21 A 2002 report by MCG Consulting Group for the Prison Service Pay Review Body examined the pay and employment packages offered within privately-managed prisons. This found that the average basic pay of PCOs in the private sector was £14,500 compared with an average salary of £18,500 for public sector prison officers. Figure 17 compares pay and conditions for prison officers and PCOs.
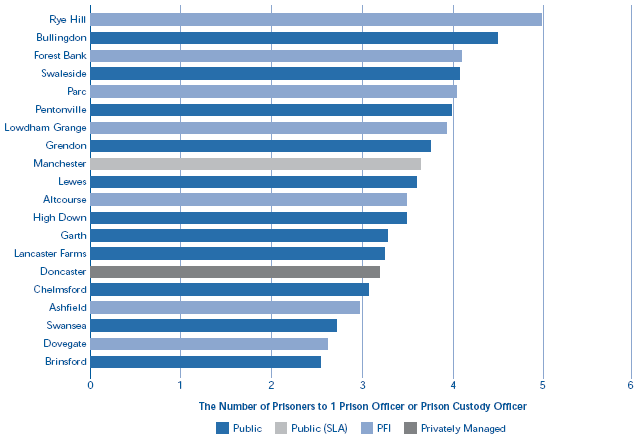
2.22 There are generally fewer staff per prisoner in PFI and privately-managed prisons than in public prisons. Some private sector Directors and Prison Service Governors we interviewed felt that staffing levels had been set too low in recent bids (Figure 18 overleaf). The issue of safe staffing levels is complicated however, by the difference between staffing levels in bids and indicative levels in contracts, and the actual number of staff in post. For example, Ashfield was understaffed over long periods due to recruitment and retention problems and could not maintain the indicative staffing levels in the contract. This suggests that the problem is not necessarily the numbers of staff which bidders feel are necessary to run prisons but the ability to recruit to this level. Recruitment and retention problems were greater in areas of low unemployment. Ashfield had more trouble recruiting and retaining staff than Lowdham Grange, even though both are run by the same company.
16 |
| Annual Staff Turnover (01-02) |
|
|
|
|
| Source: HM Prison Service and Private contractors: Securicor Custodial Services, Group 4 Falck, Premier Prison Serivces Ltd and UK Detention Services |
17 |
| Comparison of pay and conditions for Prison Officers and Prison Custody Officers (2001-02) | ||
|
|
| ||
|
|
| Prison Officer | Prison Custody Officer |
|
| average basic pay £ p.a. | £18,550 | £14,500 |
|
| pay range | £16,159-£23,110 | £11,500-£17,500 |
|
| average weekly contracted hours | 39 | 40-42 |
|
| overtime pay | Time off in lieu, or up to 9 hrs a week for 13 wks at £11/hr | None, flat rate or 1.5x |
|
| pension | Final salary scheme1 - employer contribution rate equivalent to 18.5% | Money purchase scheme. Employer contribution between 2-5% |
|
| annual leave (days) | 22-30 | 20-27 |
|
| 1 Public sector prison officers may join the Principal Civil Service Pension Scheme. The employer contribution rate is based on Government Actuary figures in the 2000-01 resource accounts for the scheme. Source: “The Employment Framework in Privately Managed Prisons”, MCG consulting for the Prison Service Pay Review Body, September 2001 | ||
18 |
| Prisoner to Staff Ratios |
|
|
|
|
| This data was not available for Wolds (a privately managed prison) Source: Her Majesty's Prison Service and Private Contractors |
__________________________________________________________________________________________________
19 However, Parc (a PFI prison) Lancaster Farms and Swansea (public prisons) perform well in both areas - in our traffic light analysis they did not have a red indicator for any of the following: assaults, escapes, drug testing, security audit, purposeful activity, qualitative data, staff survey or prisoner survey (which looked at decency issues).
20 See, for example, “Measuring the quality of prison life” (2002) Findings No. 174, Home Office.
21 Comparing assaults figures between the public and the private sector can be problematic given that it is generally agreed that prison contractors are subject to a more stringent measurement regime.