Forecast headcount has changed since conception of the project
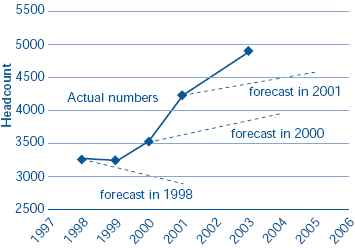
1.25 When Best and Final Offers were invited in 1998, the Home Office estimated a reduction in its central London headquarters staff, including those employed by the Prison Service, from 3200 to 2920. This forecast reduction was expected to result from a downward pressure on pay and other running costs, outsourcing, efficiencies from streamlining of support services and efficiencies resulting from a change in working practices and culture resulting from modernisation initiatives and improvements in IT. Figure 4 opposite shows that the expected reduction did not occur; in fact, between 1998 and 2003, core Home Office and Prison Service staff numbers increased to about 4900. This includes vacancies being filled. The Home Office attributes this large rise to rapid increases in activity to meet increasing workload being put on the Department by Ministers and in the case of the Prison Service headquarters, by the rapid increase in the prison population.
1.26 Although the accommodation project team carried out annual surveys of business units the rapid rise in staff numbers made it difficult for them to maintain up-to-date information on current staff numbers and to forecast future headcount. This arose partly because the Home Office Human Resources function records and projects numbers on a nationwide basis whereas the accommodation project required forecasts for central London only. The project team recognised this was a weakness and began to reconcile Human Resources planning with their own projects from June 2001. The accommodation project also needed to take account of contractors and other non-payroll occupiers which the Human Resources figures did not include. The outcome of these difficulties was that Human Resources were forecasting expansion before the accommodation project was aware of it. Human Resources first started to forecast national staff increases in autumn 2000 but this was not picked up by the accommodation project until the following year.
4 |
| Comparison of how actual staff numbers and forecast have changed over time |
|
| This graph shows that actual staff numbers have increased rapidly since 1999. The project team forecast in 1998 was for a drop in numbers |
|
|
|
|
| NOTE The blue squares show points of assessment. For clarity changes between these squares are shown as straight lines. In practice the changes will have occurred in more complex ways. |
|
| Source: National Audit Office analysis |