Cost of PFI services
There is variation in the cost of services but this also exists in non-PFI hospitals
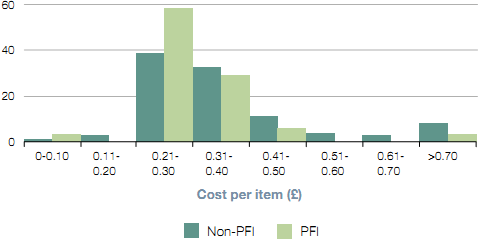
2.7 There is considerable variation of reported costs for services between PFI hospitals. For example, the range of costs reported in 2007-08 for feeding a patient per day was £3.16 - £12 and the cost per item laundered was £0.20 - £0.96 (these figures and our concerns with the quality of the data are covered in Figure 11 overleaf).
2.8 Typically, the individual costs of PFI services are paid in a single unitary charge to the Trust. High prices on one service may theoretically be compensated by low prices on another. Another major cause of variation in costs is location. However, our analysis shows that there is considerable variation between PFI contracts even after taking account of these factors. A fuller explanation and results of this cost analysis can be found on our website.2
2.9 We could not verify if the difference in costs was due to a difference in the quality of performance or contract specification. There was no correlation between cost and Trust satisfaction or Patient Environment Action Team scores. Given that the causes of the price differences are not known, there may be a risk that some are paying more than they need to.
2.10 There is also considerable variation in the costs of all services in non-PFI hospitals. The range of costs for PFI services overlaps considerably with that of the same services provided outside of PFI contracts. The extent of the overlap is such that the costs are broadly the same between PFI and non-PFI hospitals for all services.
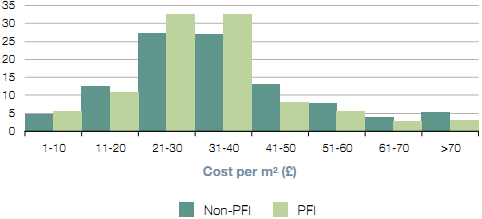
2.11 The average cost of portering, cleaning and laundry services delivered under PFI contracts differ from the average costs of the same services at other hospitals. But the differences are small relative to the range of costs and are not statistically significant. That is, they appear to be due to the general variation between hospitals rather than a systematic difference between PFI and non-PFI hospitals.3
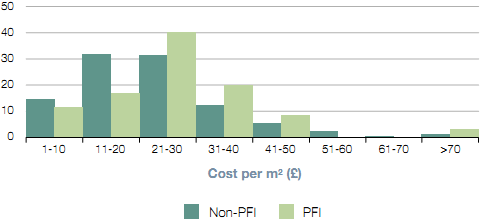
2.12 The average annual spend on estates maintenance is higher in PFI hospitals, although this difference was only statistically different in two of the three years we measured. PFI contracts require the building to be maintained to a high standard and commits the Trust to pay for maintenance over the life of the contract. In conventionally procured hospitals, Trusts have the ability to determine expenditure on maintenance, providing greater flexibility, but potentially leading to higher refurbishment costs later or a degraded physical environment.
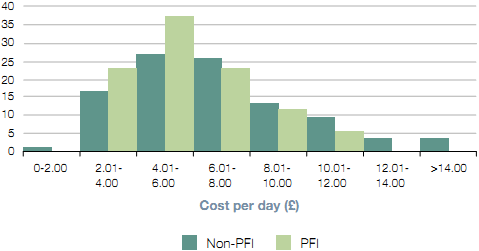
2.13 The average cost of patient catering services is cheaper in PFI hospitals, although this was only statistically different in 2007-08. Performance scores (Figure 7 on page 19) do not suggest a significant difference in the quality of catering.
|
Figure 11 Maintenance PFI maintenance service costs are consistently on average higher than non-PFI maintenance, although the ranges overlap significantly. This difference was statistically significant in two of the three years for which we have data. |
|
|
2005-06 |
2006-07 |
2007-08 |
|||
|
|
Non-PFI |
Non-PFI |
Non-PFI |
|||
|
Cost of maintenance per m2 of gross internal site floor area (£) |
20.531 |
24.321 |
21.74 |
22.82 |
23.531 |
27.531 |
|
Cost of Estates Maintenance 2007-08 Percentage
|
|
Cleaning There is no consistent pattern in the difference between PFI and non-PFI cleaning costs, and the differences are not statistically different. |
|
|
2005-06 |
2006-07 |
2007-08 |
|||
|
|
Non-PFI |
Non-PFI |
Non-PFI |
|||
|
Cleaning cost per m2 of occupied floor area (£) |
31.24 |
28.55 |
28.76 |
32.98 |
35.86 |
33.05 |
|
Cost of cleaning a square metre of hospital 2007-08 Percentage
|
|
Catering PFI catering has consistently cost less on average than non-PFI catering. However, the difference only grew wide enough to be statistically significant in 2007-08. |
|
|
2005-06 |
2006-07 |
2007-08 |
|||
|
|
Non-PFI |
Non-PFI |
Non-PFI |
|||
|
Cost of feeding a patient per day (£) |
6.71 |
6.44 |
7.39 |
6.49 |
7.391 |
6.271 |
|
Cost of feeding one patient per day 2007-08 Percentage
|
|
Laundry There is no consistent pattern in the difference between PFI and non-PFI laundry costs, and the differences are not statistically different. |
|
|
2005-06 |
2006-07 |
2007-08 |
|||
|
|
Non-PFI |
Non-PFI |
Non-PFI |
|||
|
Cost per item laundered (£) |
0.45 |
0.41 |
0.41 |
0.43 |
0.45 |
0.44 |
|
Cost per item laundered 2007-08 Percentage
|
|
Portering Portering cost data is very variable, there is no consistent pattern in the difference between PFI and non-PFI, and the differences are not statistically different. |
|
|
2005-06 |
2006-07 |
2007-08 |
|||
|
|
Non-PFI |
Non-PFI |
Non-PFI |
|||
|
Cost per portering per occupied bed (£) |
1,735 |
1,678 |
1,973 |
2,196 |
2,168 |
2,037 |
|
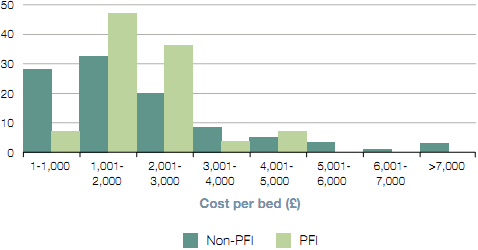
Cost of Portering per Occupied Bed 2007-08 Percentage
|
|
NOTES 1 Highlighted differences are statistically significant. Data source: Estates Return Information Collection (Eric) database is a compulsory return for all hospital sites covering the cost, quality and volume of estates services. The extent of the variation in costs in the database raises questions about the integrity of some of the data. Whilst the NHS Information Centre, which compiles the database, has systems in place for challenging Trusts who enter data which vary significantly from the norm, or appear erroneous, it does not change data if the Trust chooses not to update their response. We have cleaned the data to remove all the erroneous figures outside the bounds of plausibility, but would caution that some of the remaining data, particularly the outliers, may be inaccurate. Nonetheless, the distribuiton of the data folllows a pattern consistent with a low overall error rate and there is no reason to believe there is a systematic bias in the error rate in favour or against PFI. Given the verification systems in place at the NHS Information Centre, it is reasonable to draw the conclusions we have on the similarity of average costs between PFI and non-PFI hospitals. This data was only collected at a Trust level, rather than a site level, in 2008-09. That year is not presented here. |
___________________________________________________________________________________________
2 www.nao.org.uk www.nao.org.uk/pfi-hospitals-2010.
3 There was no difference at the 95 per cent confidence level when a 2-sided T test was applied comparing the PFI population to the rest of the hospital population. This tests whether the variance between sub-sets is greater than could be explained by the variation in the whole population.