Capacity, skills and resources
Most Trusts are well placed to manage contracts day-to-day, but some don't devote sufficient resources towards it
3.4 The size of team a Trust needs to manage its contract depends on the contract's size. The largest contracts have Trust teams of up to 13 people and the smallest require only a small team to manage them.
3.5 Trusts and the Department have tended to focus their resources and attention on the tendering, rather than the management, of PFI contracts. Several of our case studies told us that they initially underestimated the level of resources which would be required to run the contract when it became operational.
3.6 But some Trust teams are too small to cover the basic list of tasks necessary to protect value for money. We consider that the minimum requirement to run even a small PFI contract effectively is one contract manager spending the majority of his or her time managing the contract. Twenty-seven Trusts (36 per cent) have less than one full time person managing their contract. A further nine (12 per cent) do not have anyone spending a day a week managing their PFI contract (Figure 12 overleaf).
3.7 Our 2007 report on central government service contracts found most Departments believe they could improve value for money through better contract management. The Departments had not allocated appropriate skills and resources to the management of service contracts.4 Comparing the 2007 data with the evidence collected for this report, we found Trusts' management of their PFI contracts is comparable with central government departments' management of their major service contracts. The PFI contracts, however, provide more structured management mechanisms and there is better networking between Trust contract managers.
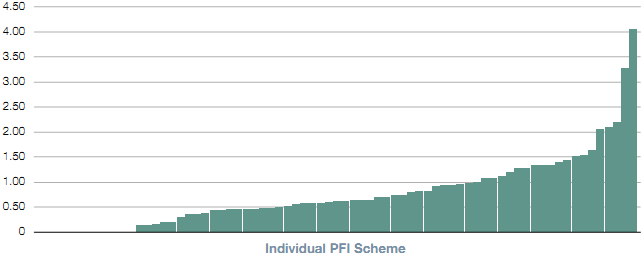
Figure 12 The amount Trusts spend on managing their contracts varies greatly and some are spending nothing Contract management spend as a proportion of unitary charge (%)
|
| Min |
| Max |
| Mean |
|
Full Time Equivalent1 | 0.2 |
| 12.8 |
| 2.3 |
|
Annual Spend (£000)1 | 5 |
| 672 |
| 106 |
|
Annual Spend as a Proportion of Unitary Charge (%) | 0.1 |
| 4.5 |
| 0.9 |
|
NOTE 1 Twelve schemes reported no expenditure on contract management. Source: National Audit Office Survey |
___________________________________________________________________________________________
4 Central government’s management of service contracts HC 65 2008-2009.