The PPP operates within the standard UK model of utility regulation
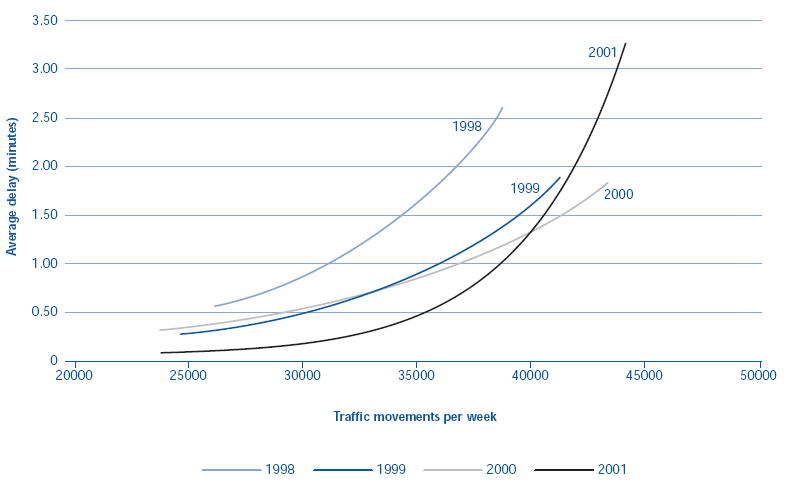
3.2 As shown in Part 1 of this report, NATS managed to keep pace with heavy growth in air traffic during the 1990s. Of greater concern for the future is evidence that continued increases in traffic levels will have a more than proportionate impact on delays unless capacity is increased, (Figure 16). The Government was concerned that besides securing the necessary investment to increase capacity, progress should also be made in reducing NATS' charges, which were the highest in Europe, (Figure 2).
15 |
| Making a success of NATS |
|
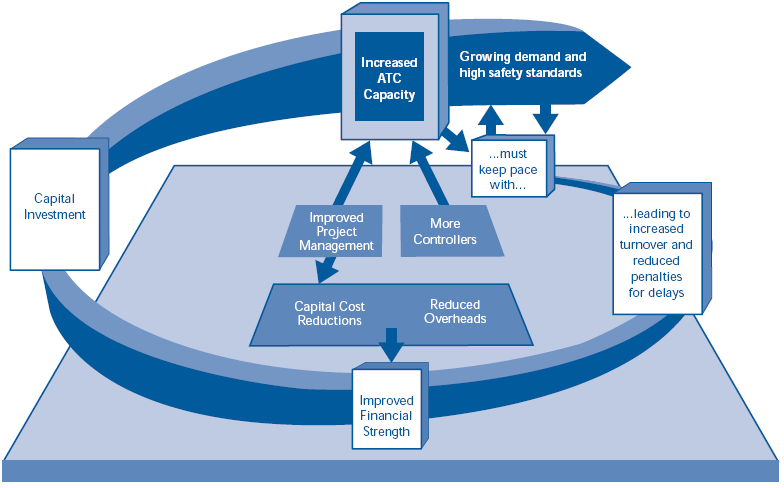
| The key challenge facing the Public Private Partnership will be to provide the increased capacity to meet growing demand in air travel, and to use the financial rewards to build for growth in the future.
Source: National Audit Office |
16 |
| How NATS' delays rose with increased traffic levels, 1998-2001 |
|
| The curves shown are a best fit of the relationship between numbers of flights and delays in each year. Shifts to the right between years indicate improvements in UK airspace capacity (more traffic being delivered for the same delay). Higher delays in 2001 may have been due to the need to remove controllers from operational work to train them on the new systems at Swanwick.
Source: NATS |
3.3 To incentivise investment while reducing charges to airlines, the Department adopted for the NATS PPP the RPI-X price regime, which has become standard practice in this country's approach to regulation of utility companies. Regulators set price or revenue limits every four or five years, which should enable the companies to deliver the services expected of them. Prices are set such that the company's revenue should cover operating expenses, depreciation and a reasonable return on its investment in assets. This regulatory approach ensures that prices change in a predictable way, and usually less than retail price inflation. Our recent report "Pipes and Wires" (HC 723, April 2002) concluded that the way regulators have applied the RPI-X approach has brought considerable benefits to both consumers and companies in the water, electricity and telecommunications sectors. Companies have become more efficient, and not at the expense of quality of service. Though most experience in using RPI-X has been in domestic utilities, the Civil Aviation Authority also uses it in regulating charges to airlines at UK Airports.
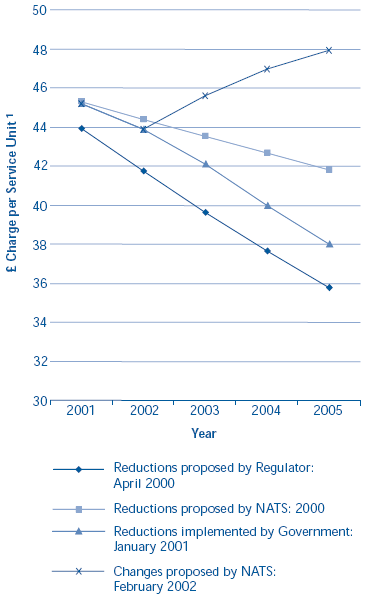
3.4 In preparing for the PPP, the Department consulted openly on the regulatory regime for NATS, receiving views from NATS, its customers and potential bidders, as well as formal advice from the Civil Aviation Authority. Ministers had assured Parliament that on no account would they set the price cap at a level that would create operational difficulties for NATS. Figure 17 below shows that in setting a price cap for the first five years of the Partnership, the Department steered a middle course between the differing views of the Civil Aviation Authority and of NATS. In doing so the Department took into account:
■ the likely effect on sale proceeds of tighter prices;
■ the risk that a relatively stringent price cap might constrain delivery of investment;
■ the limitations of data, and uncertainty as to NATS' future costs; and
■ the need for a smooth transition into the PPP.
3.5 The reductions in prices implemented by the Department would, by the end of the five year period, have reduced NATS' real charges to a level close to the current average in Europe.
17 |
| Proposals for reducing NATS' real charges to customers in the first five years of the PPP |
|
| The Government steered a middle course between the recommendations of the Regulator and NATS. In the changed circumstances since September 2001, NATS has requested a rise in prices.
NOTE 1. CHARGE PER Service Unit. This is the level of charge that NATS would be entitled to levy on its users. One service unit is generated by a plane of 50 tonnes flying for r100km through UK airspace. Source: The Department and the CAA |
3.6 Another important aspect of the arrangements for economic regulation was to provide a direct financial incentive on the Strategic Partner to minimise delays to flights. Air Traffic Control Charges represent only some three to five per cent of airlines' total operating costs, and in 2000, the average en route charge per flight was around 480 euros. The average cost per flight of en route air traffic control delays was in the region of 170 to 250 euros2. Costs to passengers were higher still.
3.7 The Department recognised that airlines regard reducing delays as more important than price cuts through regulation. Conversely they, the Regulator and NATS all agreed that any penalty regime for delays should be capped, to avoid pressures on management to put punctuality ahead of safety. The Department again steered a middle course between the differing views of NATS and the Regulator as to the level of this cap, (Figure 18).
3.8 The delay penalty regime is the first of its kind anywhere in the world of air traffic control, and has been designed cautiously. It therefore has a number of limitations:
■ With the cap, NATS' maximum penalties are smaller than the likely costs to it of increasing capacity to reduce delays, which NATS estimated to be around 30-35 per cent of its investment programme, or around £30 million each year. During consultation on the proposals, the Airline Group wanted to see a stronger delay penalty. However, NATS has other incentives to increase capacity, notably the commercial incentive to handle more flights, and the demands of its airline shareholders.
■ Penalties do not apply until NATS' average delays per flight exceed the 1.2 minutes it achieved in 1999. Though this is a demanding achievement in historical terms because 1999 was a good year for NATS, it is still above the one minute target set by Eurocontrol (paragraph 1.2).
■ The penalties are applied through a reduction to NATS' standard rate two years later. A system to direct rebates to the routes or users who suffered the worst delays was rejected as too complex, and might also fall foul of Eurocontrol regulations on charges.
Following the introduction of Swanwick into operational service, restrictions were imposed while air traffic controllers familiarised themselves with the new system. The average delay per flight in the year to date (mid June 2002) is 2.18 minutes.
18 |
| Maximum penalties in the PPP for flight delays due to NATS' performance | |||||
|
| The Department gave NATS two years' grace before it would face the full risk of penalties proposed by the Regulator. | |||||
|
|
|
|
| £ Million |
|
|
|
|
| 2001 | 2002 | 2003 | 2004 | 2005 |
|
| Proposal by the Regulator | 5.7 | 5.7 | 5.7 | 5.7 | 5.7 |
|
| Proposal by NATS | 2 | 2 | 2 | 2 | 2 |
|
| Adopted by the Department, December 2000 | 2 | 2 | 5.7 | 5.7 | 5.7 |
|
| As a proportion of NATS revenue (1) | 0.5% | 0.5% | 1.3% | 1.3% | 1.3% |
|
| Penalties applied to date | T.B.C. |
|
|
|
|
|
| NOTE 1. Penalty expressed as a percentage of projected En Route revenue, December 2001 Source: National Audit Office and NATS | |||||
__________________________________________________________________
2 Costs of Air Transport Delay in Europe, Institut du Transport Aerien, November 2000