The Trust has assessed the facilities management services as largely in line with the contract though with some occasional exceptions
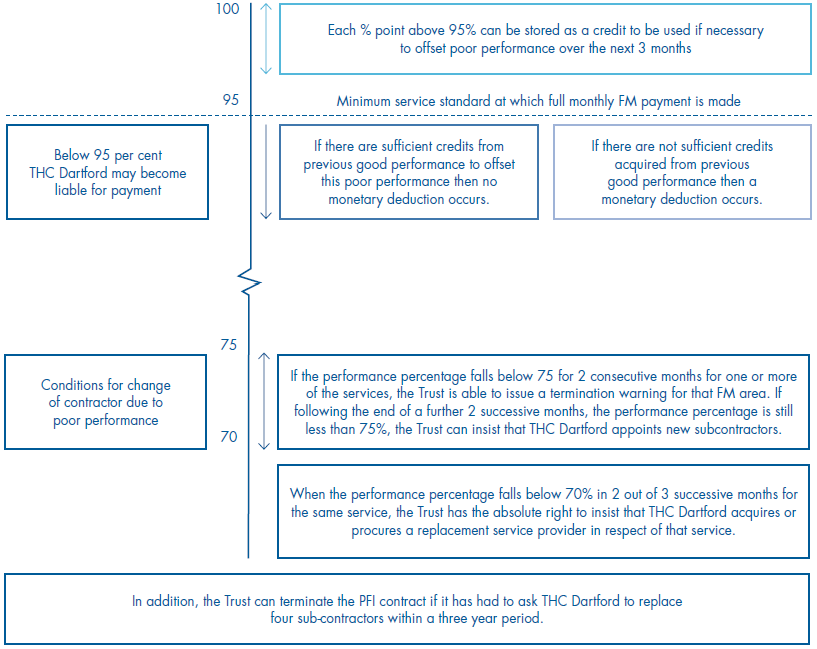
1.22 Performance of the facilities management (FM) services is measured according to a percentage scale. A key feature of the arrangements is the Minimum Service Standard, (Figure 5).
1.23 Figure 6 (see separate sheet) shows the achieved level of performance for FM services since the start of the contract. The main features are:
■ the aggregate performance of FM services each month has been at least 95%, the minimum service standard required for THC Dartford to be paid in full for particular services.
■ the aggregate performance of FM services was well above the minimum service standard up to mid 2002 but then declined through to mid 2003, partly due to the Trust being more rigorous in its assessment of performance. Performance then recovered and has remained largely above the minimum standard.
1.24 Aggregate performance, and also performance in each of the service categories used to determine payments to THC Dartford, is a composite of scores for a number of individual FM services. THC Dartford's performance over time is shown in Figure 6 (see separate sheet) and a summary of THC Dartford's performance by service category is given in Figure 7 on page 16. This shows that there were some variations in performance, particularly in summer 2003, when THC Dartford experienced problems maintaining a satisfactory level of performance in some areas. Most of these problems have been overcome but some have yet to be resolved fully – for example, discussion between the Trust and THC Dartford continues over the necessary level of portering services.
5 | Scale for performance measurement |
| |
Source: Trust's performance measurement system | |
6 | Summary of the payments and deductions made to THC Dartford from 2000 to July 2004 (excluding VAT) |
| 2000-01 | 2001-02 | 2002-03 | 2003-04 | April-July |
Payments to THC Dartford before deductions |
|
|
|
| |
Total Basic Charge1 | 9,990 | 17,941 | 18,3061 | 16,6361 | 5,662 |
Other Charges (analysed below) | 1,037 | 2,341 | 2,168 | 2,423 | 937 |
| 11,027 | 20,282 | 20,474 | 19,059 | 6,599 |
Deductions |
|
|
|
|
|
Availability | 0 | -4 | 0 | 0 | 0 |
FM Services | -10 | -1 | -02 | -7 | 0 |
Waste (discount) | 0 | -19 | -4 | -5 | -1 |
Total deductions | -10 | -24 | -4 | -12 | -1 |
Payments to THC Dartford after deductions | 11,017 | 20,258 | 20,470 | 19,047 | 6,598 |
Other Charges |
|
|
|
|
|
Utilities & Insurance | 529 | 963 | 980 | 989 | 486 |
Rates | 444 | 861 | 875 | 890 | 365 |
Capital works, minor works and additional works | 5 | 221 | 220 | 3824 | 36 |
Additional FM services | 59 | 296 | 216 | 152 | 47 |
Miscellaneous | 0 | 0 | -1233 | 105 | 35 |
Total | 1,037 | 2,341 | 2,168 | 2,423 | 937 |
Source: THC Dartford invoices (with the exception of 2000-01 where the figures are taken from the Trust's final accounts). | |||||
NOTES 1 The total basic charges are based on THC Dartford's invoices in the respective financial years to 31 March. The charge for 2003-04 was lower than 2002-03 because the Trust had started to receive its annual share of the refinancing gain by way of a reduction to its PFI contract price. The amount for 2002-03 shown above was the charge before the additional lump sum receipt in that year of £1.5 million from the refinancing. 2 A deduction was made of less than £1,000. 3 Credit to the Trust relating to a contractual agreement concerning £5 million for equipment. 4 This includes payments for the building works on the A&E extension, the staff common room and the day care pre-assessment. 5 Lease - The Learning Centre. | |||||
[Access 6 Trends in Facilities Management (FM) Services: average of the performance percentage scores awarded to the FM services each month – PDF]
7 | Performance of FM services compared to the minimum service standard |
Service | Performance |
Switchboard and telecommunications | Usually above |
External security | Consistently above |
Car parking | Consistently above |
Estates & Maintenance, Grounds and Garden | Usually above |
Linen and Laundry | High performance prior to February 2003, then problems following a change of supplier (Appendix 5). Performance has since improved and Linen and Laundry is now performing above minimum service standard |
Domestic services (cleaning), window cleaning and pest control | Usually at or above minimum service standard, but some problems were experienced in Summer 2003 |
Portering, transport and internal security | Generally above minimum standard but some lapses |
Catering | Some problems in Summer 2003 but performance currently above minimum standard. |