Given the risks and complexity of the redevelopment the estimated cost of a conventionally procured project could fall within a wide range
2.52 Where such a large number of risks and variables are involved in a project a single value output from a PSC will give a misleading impression of the accuracy of the estimate of the cost of the project. Depending on how risks materialise and interact with each other during the life of the project, the actual eventual cost could fall within a potentially wide range of values. It is possible to use a technique known as Monte Carlo simulation to estimate the probabilities of each of these values occurring and to plot this as a probability distribution.
11 |
| The PSC represented as a distribution |
|
|
|
|
| NOTE 1. To arrive at the final mean PSC figure (£746.2 million) MOD made three adjustments to initial costings totalling £24.2 million. These were: an adjustment to the risk profile following increased capital costs arising from the survey programme (£8.0 million); a landlord credit for early release of a central London building (£5.9 million), and the estimated costs of cancelling the project (£10.3 million). |
|
| Source: National Audit Office |
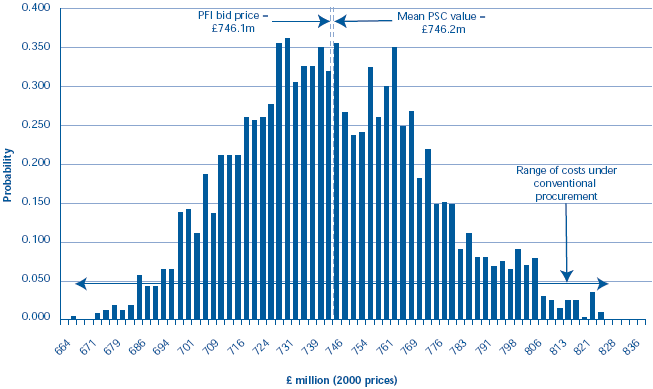
This is the approach that MOD used. It then added three adjustments totalling £24.2 million to produce the final PSC cost distribution (Figure 11).
2.53 In models of this nature it is common to see a skewed distribution reflecting the fact that the construction cost of projects have historically tended to overshoot rather than undershoot their expected values. In this instance, the distribution (see Figure 11) tended towards a symmetrical distribution. MOD explain that this is due to the capital cost risk being only one of several significant risks included in the analysis with the effect of alternative rates of inflation and also change in operating costs being very dominant in the final analysis.