10.4 Risk-adjusted PSC (advanced probability valuation technique)
| Guidance notes - Risk-adjusted PSC (advanced probability technique) |
| Detailed analysis and comparison of the PSC probability distribution of bids received as part of the procurement process should be carried out as part of bid evaluation. The shape of the distribution shows the nature of the risk profile faced by government and should be considered together with the mean PSC estimate. For instance, if the PSC probability distribution is positively skewed (i.e. skewed with a long tail to the right), a bid that lies above the PSC mean case could still be attractive to government as it may provide greater cost certainty and reduce the government's overall exposure to cost volatility. |
| The 5th and 95th percentiles can be included in the analysis simply to illustrate the P90 range or 90 per cent confidence limit within which the cost of risk is likely to fall. However, no greater weight should be given to these results than any other percentile result in the distribution. |
Table 10-4 details the results of the advanced probability analysis expressed as the mean outcome from the risk simulation.
Table 10-4: Advanced probability analysis
|
| Mean |
| % of risk-adjusted PSC |
| Total non-risk-adjusted project cost (incl. Competitive Neutrality but excl. GST) | 335.8 |
| 72 |
| 12.8 |
| 3 | |
| 116.0 |
| 25 | |
| Total risk-adjusted project costs (excl. GST) | 464.6 |
| 100 |
The costs of risks contained in Table 10-4 above are mean estimates (i.e. weighted average) among a range of possible outcomes. It is, therefore, important to focus on the probability distributions generated by the advanced probability valuation technique rather than simply looking at the mean result in isolation. The best way to analyse these results is by looking at the shapes of the distribution curves for retained and Transferred Risk and for the Total PSC minus Retained Risk.
| Guidance notes - Risk distribution curves |
| A knowledge of the Retained Risk probability distribution is important to assist government in providing for, and managing, such risks. However, given that Retained Risk, by definition, is always held by government, it is not a consideration in assessing whether bids offer value for money in comparison with the PSC (assuming that bids are not based on a different scope of Retained Risk - see Section 8.1). |
| Accordingly, the focus for bid evaluation purposes is the probability distribution for Transferred Risk transposed onto the Raw PSC and Competitive Neutrality adjustment, i.e. the Total PSC minus Retained Risk. |
Figure 10-1 illustrates the frequency distribution for Transferred Risk detailing the mean and, for illustrative purposes, the 5th and 95th percentiles.
Figure 10-1: Transferred Risk frequency distribution and mean
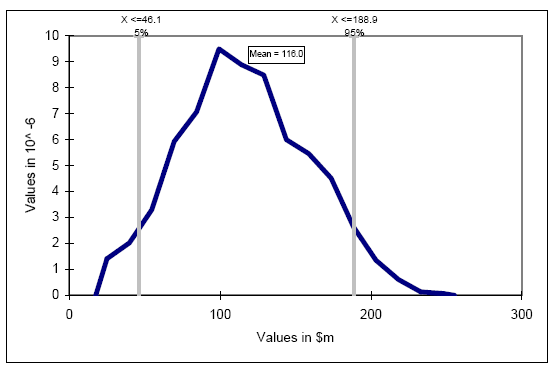
Figure 10-1 shows that the most frequently occurring value during the simulation is around $100 million and the mean estimate is $116 million. However, the distribution shows that Transferred Risk could have a cost impact of around $190 million at the 95th percentile (although the probability of this occurring is relatively low).
Figure 10-2 illustrates the frequency distribution for the Total PSC minus Retained Risk, detailing the mean, and for illustrative purposes the 5th and 95th percentiles. Of the frequency distributions produced, this is the most useful and will be the key benchmark against which PPP bids are evaluated.
Figure 10-2: Frequency distribution - Total PSC risk distribution less Retained Risk
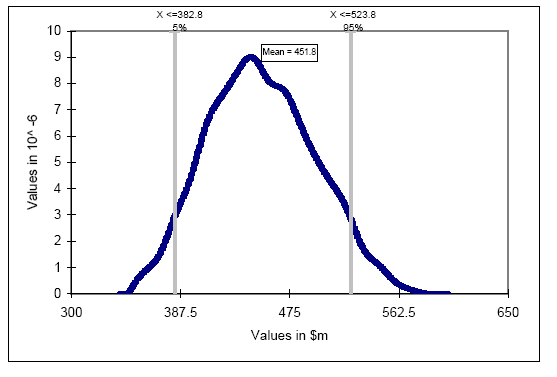
Figure 10-2 shows a slightly skewed distribution for this particular project.
The most frequently occurring value during the simulation is at around $445 million, which is slightly less than the mean of $451.8 million. However, the positively skewed distribution shows that the PSC (minus Retained Risk) could have a cost impact of over $520 million at the 95th percentile (although the probability of this occurring is relatively low).
| Guidance notes - Risk distribution curves - advanced or simple evaluation technique The lower risk-adjusted PSC under the advanced evaluation technique at the mean case ($464.6 million) was purposely derived to be lower than the risk-adjusted PSC under the simple evaluation technique ($466.3 million) in order to illustrate this worked example. Depending on the risk estimates provided by risk experts, it is also possible for the risk-adjusted PSC using the advanced technique to be higher than the risk-adjusted PSC under the simple technique. |
The sensitivity of the effect of the movement of some key risk components is summarised in Table 10-5.
Table 10-5: Sensitivity analysis of the effect of movement of cost components on project cost-mean case basis
|
|
|
|
| ||
| Movement in assumption | Capital cost | Operating cost | Discount rate | Inflation rate | Maintenance and refurbishment |
| -15% | 427.4 | 451.1 | 478.6 | 466.5 | 455.8 |
| -10% | 439.7 | 455.5 | 474.4 | 465.1 | 458.7 |
| -5% | 452.1 | 460.0 | 467.5 | 464.6 | 461.5 |
| Base case | 464.6 | 464.6 | 464.6 | 464.6 | 464.6 |
| 5% | 476.7 | 468.8 | 458.7 | 463.7 | 467.3 |
| 10% | 489.1 | 473.3 | 455.2 | 462.5 | 470.1 |
| 15% | 501.4 | 477.7 | 449.2 | 461.9 | 473.0 |
Note that Table 10-5 relates to the total PSC mean estimate (including Retained Risk) and indicates that the PSC estimate is particularly sensitive to movements in capital cost estimates.