16.2.2 Advanced valuation method
Table 16-3 details the results of the advanced probability analysis expressed as the mean outcome from the risk simulation.
Table 16-3: Mean of risk-adjusted project costs (advanced probability analysis)
| Mean | % of risk-adjusted | ||
| Total non-risk-adjusted project cost (incl. Competitive Neutrality but excl. GST) | 335.8 | 72 | |
| Retained risk | 12.8 | 3 | |
| Transferred risk | 116.0 | 25 | |
| Total risk-adjusted project costs (excl. GST) | 464.6 | 100 |
The cost of risks contained in the table above are mean (i.e. weighted average) estimates among a range of possible outcomes. It is, therefore, important to focus on the probability distributions generated by the advanced probability valuation technique rather than simply looking at the mean result in isolation. The best way to analyse these results is by looking at the total risk distribution and the shapes of the distribution curves for both retained and Transferred Risk and for 'Total PSC minus Retained Risk''.
Table 16-4 contains the results of the risk simulation from the 5th to the 95th percentiles and also includes the P90 range, or 90 per cent confidence limit, within which the cost of risk is likely to fall. Table 16-4: Simulated costs of risks, 5th to 95th percentiles:
| Risk results | |||
| Percentile | Retained | Transferred | Total |
| Mean | 12 791 | 116 010 | 128 801 |
| 5% | 2 291 | 46 078 | 56 329 |
| 10% | 4 098 | 61 217 | 71 251 |
| 15% | 5 216 | 71 165 | 82 733 |
| 20% | 6 136 | 78 973 | 92 581 |
| 25% | 7 052 | 86 417 | 98 886 |
| 30% | 8 022 | 92 694 | 105 054 |
| 35% | 8 785 | 97 706 | 110 774 |
| 40% | 9 689 | 103 672 | 117 689 |
| 45% | 10 418 | 108 828 | 122 139 |
| 50% | 11 306 | 115 159 | 127 462 |
| 55% | 12 668 | 120 361 | 132 015 |
| 60% | 13 989 | 125 415 | 137 541 |
| 65% | 14 914 | 130 194 | 144 029 |
| 70% | 16 285 | 137 021 | 150 535 |
| 75% | 17 502 | 144 966 | 159 032 |
| 80% | 18 931 | 154 584 | 166 845 |
| 85% | 20 926 | 163 535 | 176 043 |
| 90% | 23 211 | 173 037 | 186 797 |
| 95% | 27 026 | 188 877 | 202 202 |
| P90 | 24 735 | 142 799 | 145 873 |
The raw statistical data generated by the advanced valuation technique and contained in Table 16-4 forms the basis for the histogram/frequency distribution plot which shows the overall shape of the risk distributions and is far more useful than the raw data for analysing risk. These charts are the most useful output from the advanced valuation technique. They show the frequency of a particular risk value in graphical form. This can be used to compare government's overall exposure to risk under the PSC with bids received.
| Guidance notes - P90 confidence limit |
| A common measure is the P90 confidence limit, defined as the difference between the 5th and 95th percentiles. The P90 describes the range in which the final project cost could lie, under a traditional government delivery, with 90 per cent confidence. While the P90 is a useful measure to illustrate the relative volatility of the PSC with, for example, PPP bids received from the private sector, it is the shape of the distribution which is most important. The focus of the analysis therefore, should be on the shape of the risk distribution as a whole, and where the major transferred or retained project risks lie. Consequently, no greater weight should be given to the mean, 5th or 95th percentile results than any other percentile result in the distribution. |
| Note that the P90 range presented in this worked example is for illustrative purposes only, and each project will have its own risk profile and statistical measures (including P90) specifically related to the nature and quantum of the associated risks (both retained and transferred). The P90 range differs from project to project and is also likely to narrow as the PSC is refined, as illustrated by the Torpedo diagram. Figure 16-1, at the beginning of this chapter. |
Figure 16-3 illustrates the frequency distribution for Retained Risk, detailing the mean, the 5th and 95th percentiles. The 5th and 95th percentiles are included to illustrate the P90 range or 90 per cent confidence limit within which the cost of Retained Risk is likely to fall. In this case, the P90 is approximately $25 million (i.e. between $2 million and $27 million.
Figure 16-3: Retained risk frequency distribution and mean
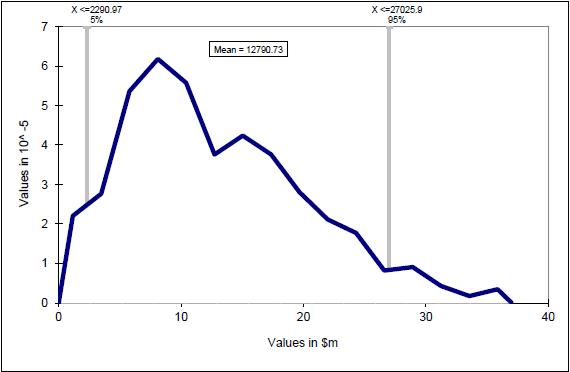
The peak (or the most frequently occurring value during the Monte Carlo simulation) for Retained Risk is approximately $8 million; however the mean is $12.8 million due to the heavily skewed distribution. This reflects the skewed cost estimates provided by the individual risk experts for the risks, where, for the majority of risks, the 'most likely case' cost impact is skewed towards the 'best case' cost impact.
Figure 16-4 illustrates the frequency distribution for Transferred Risk, detailing the mean and, for illustrative purposes, the 5th and 95th percentiles.
Figure 16-4: Transferred risk frequency distribution and mean
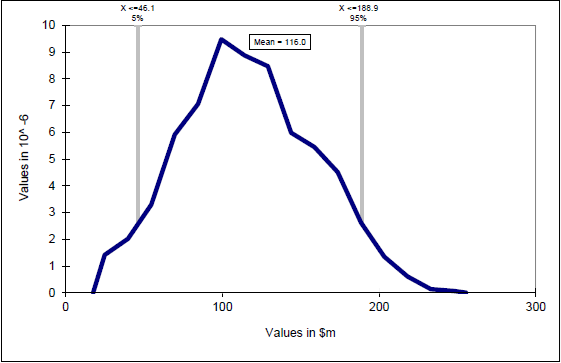
Figure 16-4 shows the frequency of distribution of Transferred Risk. For example, the most frequently occurring value during the simulation is around $100 million; however the distribution shows that Transferred Risk could have a cost impact of over $190 million at the 95th percentile (although the probability of this occurring is relatively low). This distribution shows a positively skewed profile, although this is not as pronounced as with the Retained Risks.
| Guidance notes - Retained risk |
| A knowledge of the Retained Risk probability distribution is important to assist government in providing for, and managing, such risks. However, given that Retained Risk, by definition, is always held by government, it will not be a consideration in assessing whether bids offer value for money in comparison with the PSC (assuming that bids are not based on a different scope of Retained Risk. |
| Accordingly, the focus for bid evaluation purposes will be the probability distribution for Transferred Risk transposed onto the Raw PSC and Competitive Neutrality adjustment (i.e. the risk-adjusted PSC minus Retained Risk). |
Figure 16-5 illustrates the frequency distribution for the Total PSC minus Retained Risk detailing the mean and, for illustrative purposes, the 5th and 95th percentiles. Of the charts produced, this is the most useful and will be the key benchmark against which PPP bids will be evaluated.
Figure 16-5: Frequency distribution - Total PSC risk distribution less Retained Risk
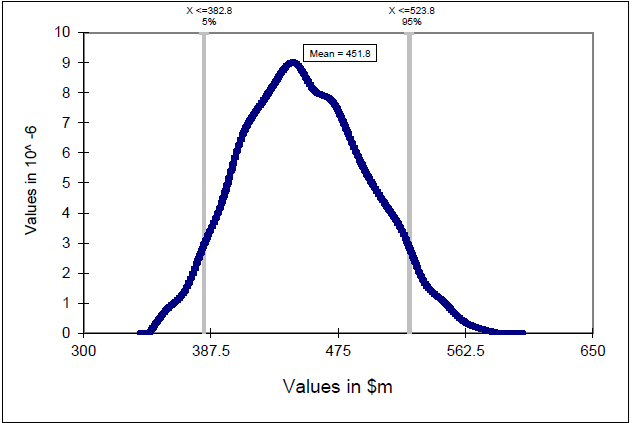
Figure 16-5 shows a positively skewed distribution for this particular project. The most frequently occurring value during the simulation is at around $445 million; however the distribution shows that the PSC (minus Retained Risk) could have a cost impact of $524 million at the 95th percentile (although the probability of this occurring is relatively low).
Note that Figure 16-5 only shows a slightly skewed distribution for this particular project. The slight skewing reflects the dominance of Transferred Risks (also only slightly skewed - see Figure 16-4) over Retained Risks (heavily skewed - see Figure 16-3) which is also shown in the quantum of the respective means.
| Guidance notes - valuation methods |
| The lower risk-adjusted PSC under the advanced evaluation method at the mean case ($464.6 million) was purposely derived to be lower than the risk-adjusted PSC under the simple evaluation technique ($466.3 million) in order to illustrate this worked example. Depending on the risk estimates provided by the risk experts, it is also possible for the risk-adjusted PSC using the advanced technique to be higher than the risk-adjusted PSC under the simple technique. |
| The advanced technique provides a more accurate picture of the risks associated with a project, as the derivation of the risk estimates themselves means that the project risks are looked at more closely. A Monte Carlo simulation more accurately calculates the risks over a large number of simulations which reflects reality to a greater degree than the calculation of risk under the simple valuation technique. |