Estimates of passenger revenues have been progressively reduced
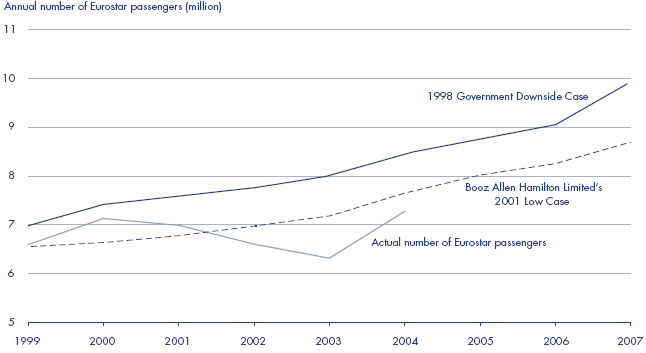
3.3 At the time of the 1998 restructuring, the Department, using the Government's Central Case for Eurostar UK's revenues, projected that LCR would suffer a cash shortfall and the 1997 present value of the additional support would be in the order of £140 million (1997 prices). Under the Government's Downside Case, the present value of the maximum expected additional support required was £360 million (1997 prices). Both estimates were calculated from cash flows net of repayments and the Government's share of revenue from forecast project related property developments. However, demand for the Eurostar service never met the Government's Downside Case (Figure 8) and, in 2000, the Department commissioned new passenger forecasts from Booz Allen Hamilton Limited, who modelled three scenarios, known in this report as the 2001 High, 2001 Mid and 2001 Low Cases. Passenger and Eurostar UK's revenue projections in the 2001 Low Case are lower than the 1998 Government's Downside Case (Figures 8 and 9).
3.4 In 2000 and 2001, actual Eurostar passenger numbers exceeded the 2001 Low Case, but in the latter year demand started falling and in 2002 and 2003 actual usage ran below the 2001 Low Case (Figure 8). The lower than forecast usage had a negative impact on Eurostar UK's passenger revenue such that, in 2003, it was approximately £25 million (1997 prices) below the 2001 Low Case and £48 million (1997 prices) below the 1998 Government's Downside Case (Figure 9). Eurostar UK attributed the drop in patronage between 2000 and 2003 to a contraction of the market between London-Paris and London-Brussels. It cited a number of factors to explain the drop:
■ the rise of low-cost airlines meant that there was not only competition on price but also on destination. Leisure travellers can choose between a multitude of European destinations when choosing short, low cost breaks;
■ a decline in Eurostar business travel attributed to weak economic conditions on the continent;
■ a reduction in leisure travel following declining consumer confidence in France;
■ the reduction in travel following the terrorist attacks in the United States on 11 September 2001; and
■ passenger frustration caused by increased levels of travel disruption following the train derailment at Hatfield and Railtrack plc's subsequent action, including the imposition of a greater number of speed restrictions on the lines used by Eurostar services.
3.5 In 2004, passenger numbers were up 15 per cent compared to the previous year (Figure 8). Eurostar UK's passenger revenues also increased and were up approximately 11 per cent in real terms compared with 2003 (Figure 9). However, both figures for 2004 were still below the 2001 Low Case. While the improvements are encouraging, it is not yet possible to say whether they will be sustained.
8 | In 2004, the number Eurostar passengers increased by 15 per cent compared to the previous year's figure and reversed a declining trend that started in 2001 |
| |
Source: National Audit Office analysis | |
3.6 In 2004, the Department commissioned Booz Allen Hamilton Limited to update forecasts of passenger demand and Eurostar UK's passenger revenues. The firm produced three principal forecasts for both passenger demand and Eurostar UK's passenger revenues - known in this report as 2004 High, 2004 Most Likely and 2004 Low (Figures 10 and 11 overleaf). The 2004 High forecast indicated that passenger numbers for Eurostar services would exceed that projected in the 2001 Low case only by 2009 (Figure 10). Both the 2004 Most Likely and the 2004 Low forecasts show expected passenger numbers below the 2001 Low forecast until about 2035 and 2045 respectively (Figure 10). In terms of revenue projections, the expectation, under the 2004 Most Likely forecast, is that annual revenues through to nearly 2050 will remain below the 2001 Low forecast (Figure 11).