2.2 Growth in alliancing
Public and private sector expenditure on infrastructure projects in the Australian road, rail and water sectors has grown significantly from 2003 to 2009, increasing from $12 billion per annum in the 2003 to 2004 financial year to $32 billion per annum in the 2008 to 2009 financial year as shown in Figure 2.1.
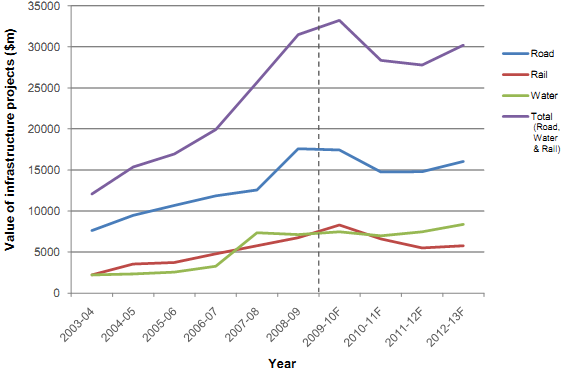
Figure 2.1: Historic and forecast infrastructure spend by sector 36
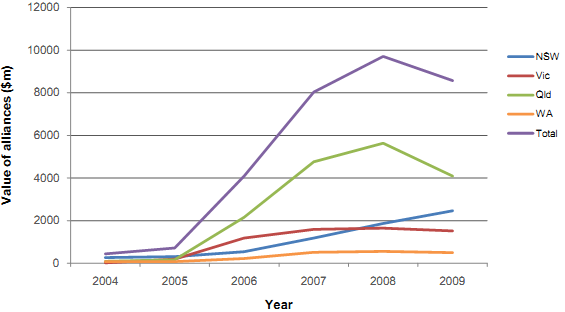
Figure 2.2: The value of alliancing projects undertaken in each state 4
The number and value of projects undertaken using the alliance delivery method has also grown over the past five years. The total value of alliance projects in the road, rail and water sectors in New South Wales, Victoria, Queensland and Western Australia, over the period 2004 to 2009 was $32 billion.
This represents 29% of the total infrastructure spend of $110 billion in the same sectors across the whole of Australia. The value of alliances undertaken in each state is shown in Figure 2.2, and the value of alliances undertaken by sector is shown in Figure 2.3.
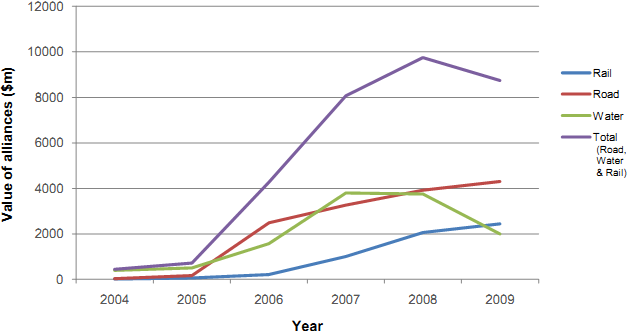
Figure 2.3: The value of alliancing projects undertaken by sector 4
Figure 2.4 compares the public sector and private sector use of alliancing across all sectors and states. It can be seen that the use of alliancing in the private sector has been relatively static while in the public sector its use has increased exponentially. Given that both sectors experienced substantial increases in infrastructure spending, it is unclear why the public sector has embraced alliancing to the extent it has but the private sector has not despite it pioneering this delivery method.
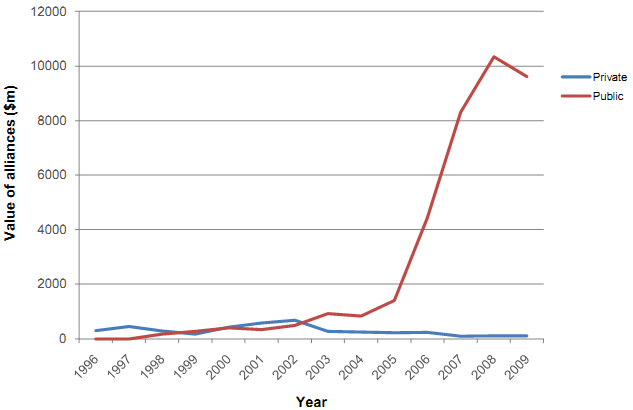
Figure 2.4: The use of alliancing in public and private sectors 4
The source data for 'private' in Figure 2.4 has been adjusted to reflect two major private sector projects that have been delayed or cancelled since the information was collected.