Sample and participant description
Respondents were grouped into two distinct categories, owners and NOPs, with NOPs comprising constructors and designers.
Seventy-one alliance projects were identified that met the study criteria of projects, and the ALT members of these projects were approached to complete the survey (a full list of these projects is provided in Appendix B). A total of eighty-two responses were received, covering forty-six alliances, with thirty-five owner responses, and forty-seven NOP responses (twenty-five constructor responses and twenty-two designer responses).
This indicates an owner response rate of 42.7 percent and a NOP response rate of 57.3 percent. Of the seventy-one alliances approached, 64.8 percent were able to be included in the study, which for this kind of survey is quite reasonable.
From the original list of seventy-one alliances, projects were located in Victoria (18.3%), New South Wales (24.0%), Queensland (45.1%), and Western Australia (12.7%).
Figures 1-3 list out the alliances that surveyed organisations have participated in. The data was gathered from the condensed Alliancing Association of Australasia inventory of alliances.
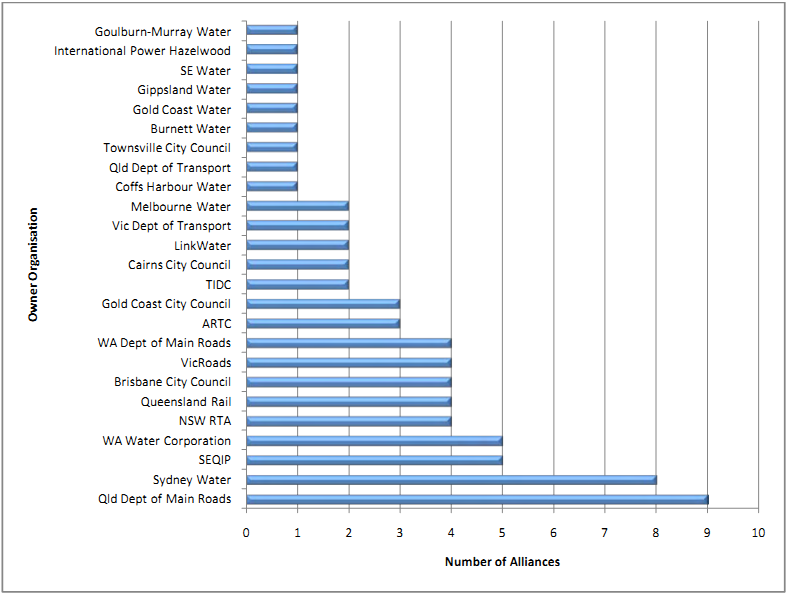
Figure 1: Owners - number of alliances involved in
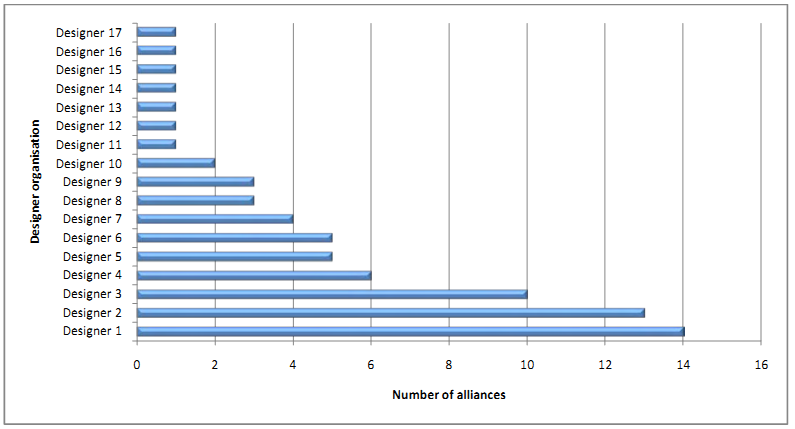
Figure 2: Designers - number of alliances involved in
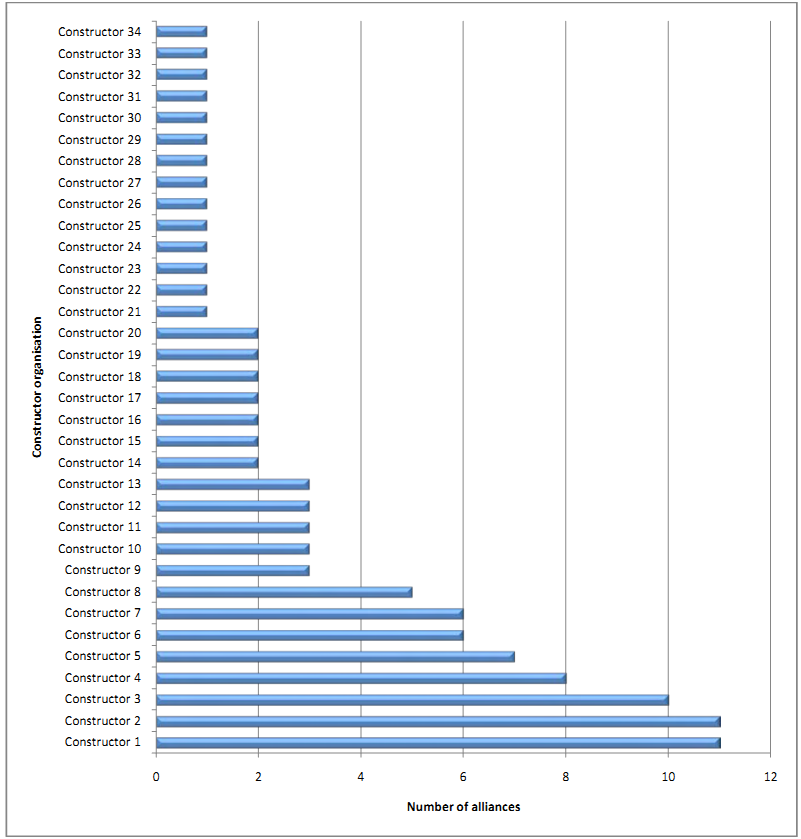
Figure 3: Constructors - number of alliances involved in
Table 1 lists out the value of alliances included in the study for each sector and within the years covered by the study. It should be noted that this does not represent the total value of alliances completed in Australia, as this study included only projects with a value of $70 million or more.
Table 1: Value of alliance projects included in this study by sector and year
Year | Water | Road | Rail | Grand Total |
2003 | $276m | $23m | $45m | $343m |
2004 | $395m | $23m | $17m | $435m |
2005 | $500m | $163m | $56m | $718m |
2006 | $1,563m | $2,486m | $220m | $4,268m |
2007 | $3,792m | $3,270m | $1,010m | $8,072m |
2008 | $3,755m | $3,921m | $2,066m | $9,742m |
2009 | $1,994m | $4,301m | $2,442m | $8,737m |
2010 forecast | $883m | $3,351m | $2,224m | $6,458m |
2011 forecast | $268m | $1,495m | $862m | $2,625m |
2012 forecast | $182m | $528m | $656m | $1,366m |
Totals | $13,608m | $19,561m | $9,598m | $42,764m |