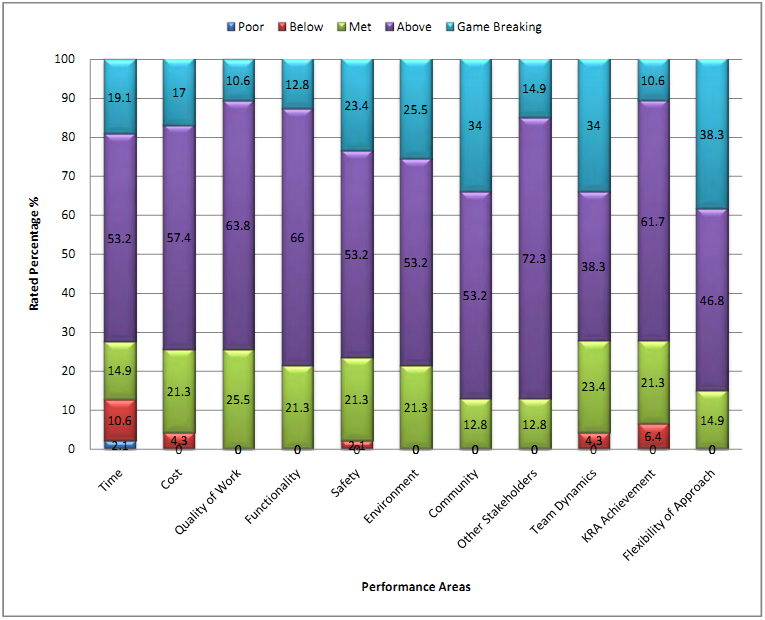
Figure 6: Alliance performance - NOPs (key areas)
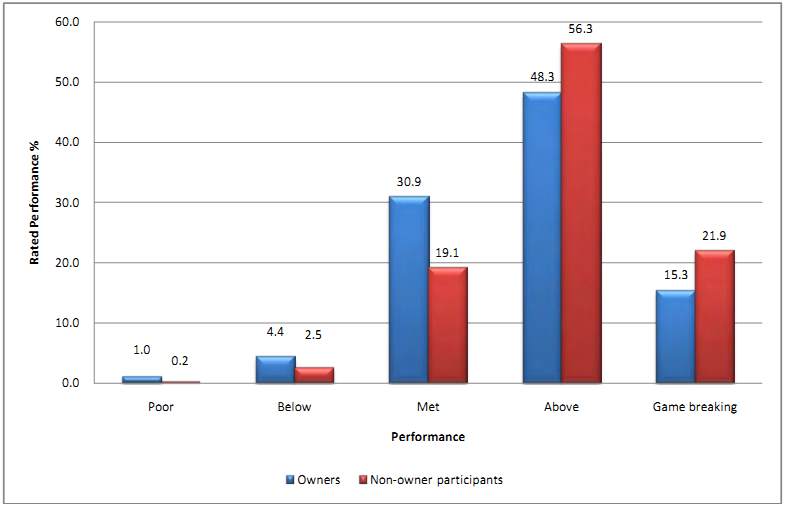
Figure 7: Alliance performance percentages - owners and NOPs (average)