Project duration comparison
Initial, final and actual project duration was also analysed. Figure 9 outlines the percentage of alliances that met the target project duration and those that fell within each 10 percent range below and over the target.
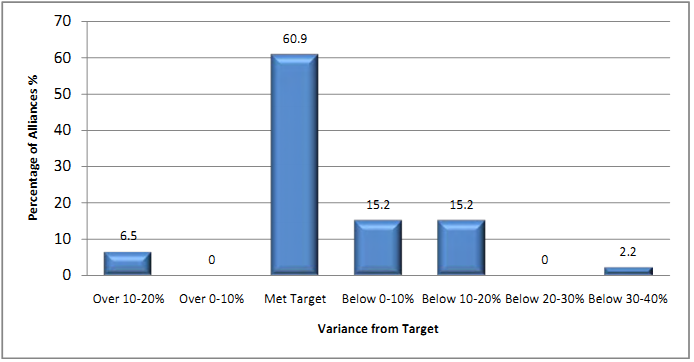
Figure 9: Variance in project duration - range
Figure 10 shows actual time and cost performance of the forty-six alliances as a percentage of final time and cost as agreed in the TOC. The majority of alliances performed well on time and cost, but it is interesting to note, the projects that ran over time, did not always run over cost, and vice versa.
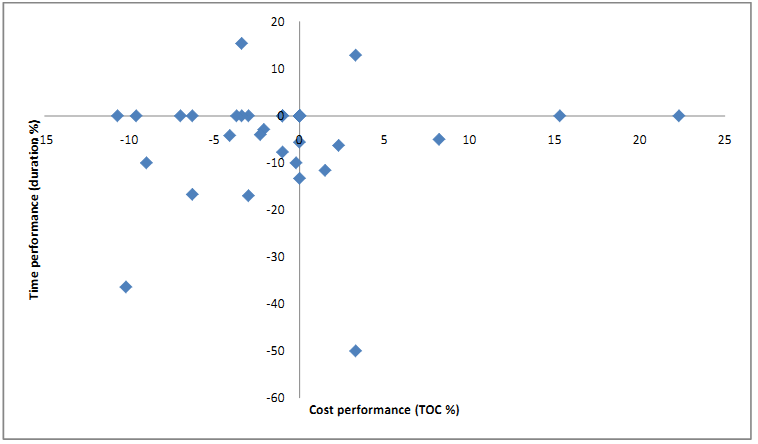
Figure 10: Final vs actual time and cost performance