Total Highway and Transit Spending
The deterioration of system performance appears at first glance to have occurred despite significant increases in total national spending on transportation infrastructure. Examining spending levels in the context of inflation, increasing vehicle and passenger travel, and economic growth, however, paints a very different picture.
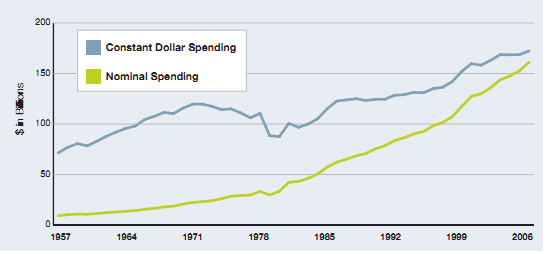
Over the last 18 years, total annual highway spending by all levels of government for capital improvements, operations, and maintenance increased 38 percent, from $125 billion in 1988 to $172 billion in 2006, in 2008 dollar terms.1 (See Exhibit 2-1.)2
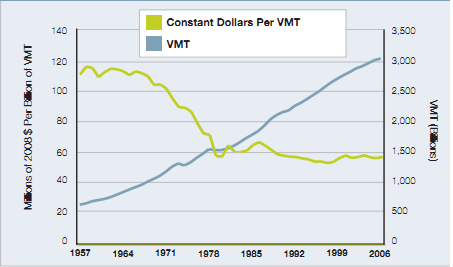
This measure of inflation-adjusted spending, however, does not account for the increasing demands placed on an aging transportation system by a growing economy and population. Between 1988 and 2006, total vehicle miles traveled (VMT) increased by over 48 percent (from 2.03 trillion to 3.01 trillion). Therefore real highway spending in constant dollars divided by VMT has actually declined by 7 percent since 1988 and has fallen by nearly 50 percent since the beginning of the federal HTF in the late 1950s.3 (See Exhibit 2-2.) | |||||
Between 1988 and 2006, total transit spending by all levels of government in- creased 48 percent, from $33 billion to nearly $49 billion in 2008 dollars.4 (See Exhibit 2-3.) The demands on transit infrastructure as measured by passenger miles traveled (PMT), however, increased by nearly 30 percent between 1988 and 2006 (from 40.6 billion PMT to 52.2 billion PMT). Transit spending, in constant dollars divided by PMT, therefore increased by only 14 percent since 1988.5 (See Exhibit 2-4.) Another common way to measure real spending is to express it as a percent of gross domestic product (GDP). This method produces very similar results. Total combined highway and transit spending as a share of GDP has fallen about 25 percent since the beginning of the federal HTF. According to data from the Congressional Budget Office (CBO), this expenditure averaged 1.9 percent of GDP from 1956 to 1970 but only 1.4 percent of GDP from 1990 to 2004.6 (See Exhibit 2-5.) |
| ||||