Maintaining Federal Investment Purchasing Power
Maintaining Federal Investment Purchasing Power Congress asked the Commission to estimate the level of funding required to "ensure that federal levels of investment in highways and transit do not decline in real terms." The Commission interpreted this to mean the 2008 federal highway and transit program funding (obligation) levels, including the General Fund support for transit. Such an estimate is a projection of future purchasing power and derived from assumptions about long-term inflation. As explained previously, the Commission used 2 percent for that purpose in this report.
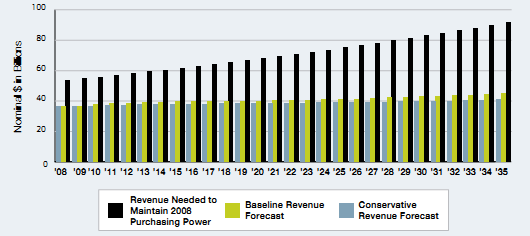
Applying a 2.0 percent long-term average annual inflation rate, the combined federal highway and transit program funding level of $53.6 billion would need to grow to $91.6 billion (in nominal terms) by 2035 for current program purchasing power to be maintained. As illustrated in Exhibit 2-21, the HTF revenue forecasts do not come close to achieving this. The Baseline Forecast revenue gap grows from $17.3 billion in 2008 to $45.3 billion Py 2035, with a cumulative shortfall of $827 billion over the 28-year period. The Conservative Forecast produces a revenue gap that grows to $55.5 billion by 2035, with a cumulative shortfall of $975 billion. To the extent average annual inflation exceeds the assumed 2.0 percent, the revenue gaps will grow that much larger.
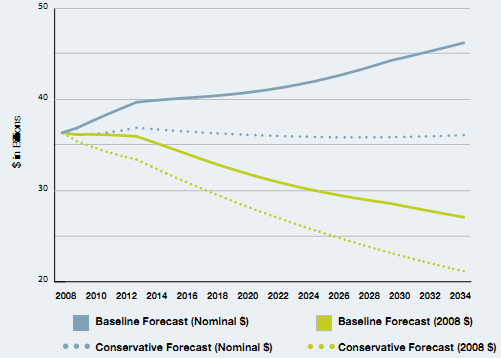
EXHIBIT 2-19: HTF BASELINE FORECAST VS. CONSERVATIVE FORECAST (HIGHER MPG ASSUMPTION) |
|
I EXHIBIT 2-20: HTF FORECAST SUMMARY | ||||||||||||||||||||
| 2008 | 2035 | Average | Cumulative | Average | Cumulative | ||||||||||||||
Baseline Forecast |
|
|
|
|
|
| ||||||||||||||
Nominal $ | $36.4 | $46.2 | $41.5 | $1,161 | $39.1 | $235 | ||||||||||||||
2008$ | $36.4 | $27.1 | $31.8 | $891 | $35.8 | $215 | ||||||||||||||
Conservative Forecast |
|
|
|
|
|
| ||||||||||||||
Nominal $ | $36.4 | $36.1 | $36.2 | $1,013 | $36.6 | $220 | ||||||||||||||
2008$ | $36.4 | $21.2 | $28.1 | $786 | $33.5 | $201 | ||||||||||||||
Data Sources and Growth Assumptions
| ||||||||||||||||||||
EXHIBIT 2-21: ANNUAL FEDERAL REVENUE NEEDED TO MAINTAIN CURRENT HIGHWAY AND TRANSIT PROGRAM PURCHASING POWER, 2008–35 |
|