Recent Estimates
The U.S. Department of Transportation is required Py law to estimate biannually the costs to "maintain" and "improve" the existing highway and transit systems and document the findings in its Conditions and Performance (C&P) report. This report is intended to provide decision makers with an objective appraisal of the physical conditions, operational performance, and funding mechanisms for highways, bridges, and transit systems. The most recent edition is the 2006 C&P report, released in early 2007 and based on 2004 data. But those cost
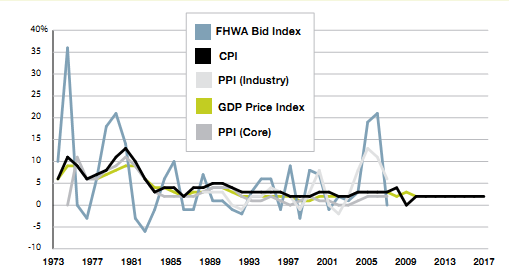
BOX 2-2: ADJUSTING FOR INFLATION | ||||||
Calculating the present value of forecasted investment needs and revenue streams requires making an assumption about future inflation trends. The Commission examined various possible indices for making inflation adjustments, including:
Long-term trends for the various measures are similar, although the indices more specifically targeted to highway and street construction are more volatile. The selection of an inflation-ad- justment metric was driven by the goal of making a variety of different revenue and expenditure forecasts over a very long time horizon. The Commission was more concerned with capturing long-term growth than predicting short-term movements. Despite the differences in historical data, available published forecasts for the CPI-U, the GDP Implicit Price Deflator, and the Global Insight Pricing and Purchasing Service Highway Construction Cost Index were similar. All three in- dices projected inflation to average between 2.0 and 2.2 percent through 2018. Given the relative consistency of the available projections, the Commission chose to use 2.0 percent as a conservative assumption in adjusting estimates for future inflation. | ||||||
| ||||||
Historical CPI - U, Industry PPI for Highway and Street Construction, and Core PPI (finished goods less food and energy) as published by the Bureau of Labor Statistics. CPI - U and GDP Price Index Forecasts from Congressional Budget Office Economic Projections. FHWA Bid Index is Composite Index of Price Trends for Federal - Aid Highway Construction, 2008. |
estimates were updated in a National Cooperative Highway Research Program (NCHRP) study, which revised inflation assumptions to account for higher-than-expected construction costs in recent years. The NCHRP-adjusted estimates have been converted to 2008 dollars and are summarized in the first two columns of Exhibits 2-22 and 2-23. They show future annual highway capital investment needs (for all levels of government) ranging from $112 billion to $158 billion, and future annual transit capital investment needs ranging from $21billion to $31 billion.37
The National Surface Transportation Policy and Revenue Study Commission developed a series of "medium" and "high" estimates of capital investment needs in its 2008 final report. These estimates were developed with the same analytical tools used for the C&P report and included scenarios with varying investment priorities and system performance goals:38 • Base Case—assessed the capital in- vestment costs assuming continuation of existing policies, programs, and trends • Scenario 1: Maximum Operations— focused on aggressive application of operations strategies such as ramp metering, traveler information, incident management, and transportation management center deployment • Scenario 2: Travel Demand and Energy Efficiency—built from Scenario 1 Put also assumed widespread use of road pricing in congested areas • Scenario 3: Aggressive System Expansion—focused on expansion of mixed-use facilities • Scenario 4: Exclusive Passenger and Freight Facilities—emphasized construction of new, separate freight and passenger rail facilities • Scenario 5: Maximum Technology— explored the Pounds of what new technologies could do Put was not fleshed out to the same extent as the other scenarios due to the lack of supporting data |
|
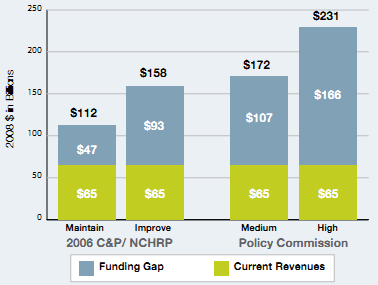
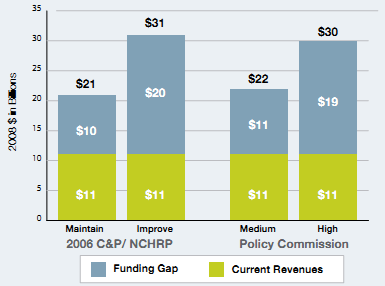
As a result of the varying implications of these investment scenarios, the needs estimates developed by the Policy Commission covered a broad range: estimates of medium highway investment strategy costs ranged from $142 billion to $201 billion annually, and high investment strategy costs ranged from $195 billion to $268 billion annually (converted to 2008 dollars).39 Transit investment needs were estimated only for the Base Case and Scenarios 2 and 3, with a range of $18 billion to $27 billion annually for the medium investment strategies and $25 billion to $36 billion annually for the high investment strategies (all figures in 2008 dollars). The combined averages of the Policy Commission estimates for highways and transit under the medium and high investment strategies are presented in the two right-hand columns of Exhibits 2-22 and 2-23 for comparison with the 2006 C&P report/NCHRP study findings.40
Exhibits 2-22 and 2-23 also show current revenues, which are the average annual revenues estimated to be available from all levels of government (federal, state, and local) to make the needed capital investments. These amounts—about $65 billion for highways and $11 billion for transit—are averaged over the 2008-35 period and expressed in 2008 dollars.41 Thus, based on the 2006 C&P report/NCHRP study and the Policy Commission estimates, the spectrum of annual average funding gaps suggested by recent forecasts ranges from $47 billion to $166 billion for highways and $10 billion to $20 billion for transit.