Base Case Investment Scenario
The Base Case Investment Scenario reflects the spending levels that would be required to sustain a business-as-usual approach to federal surface transportation investment. Key considerations that went into the development of this scenario include the following:
• The highway "cost to maintain" estimates were developed with the same basic tools, methodologies, and assumptions used for the C&P report, with adjustments to accommodate a longer time horizon.
• The highway "cost to improve" estimates were developed by setting the threshold for economically justified projects at a higher benefit-cost ratio to reflect current fiscal constraints and the desire to invest in only the highest priorities. The C&P report uses a benefit-cost ratio of 1.0 for including projects in its standard "need to improve" cost estimates. This typical threshold implies that any project that can be economically justified is considered a needed improvement. The Commission's updated estimates use a benefit-cost ratio of 1.2, which raises the bar for potential investments to be considered essential for significantly improving system performance. Using this higher ratio, the Commission's updated "need to improve" cost estimates are reduced by about 10 percent relative to the needs estimates that would have been generated with a 1.0 threshold.
• For transit investment needs, the Commission used estimates developed for a recent Transit Cooperative Research Program (TCRP) study. This approach was chosen because of concerns that the C&P report methodology, which relies on input from metropolitan planning organizations' long-term plans, is overly influenced by financial constraint requirements and does not adequately account for recent cost increases and ridership demand.42 The TCRP study relies significantly on historical growth in passenger miles traveled in estimating future needs, and the assumptions incorporate fluctuations in international commodities costs within the transportation industry. There- fore, in the Commission's scenarios, both the "cost to maintain" and the "cost to improve" estimates are based on the TCRP study cost assumptions and average annual ridership growth of 2.4 percent (the average annual growth from 1995 to 2007).43 It is also important to note that the methodology used to develop the transit "cost to improve" estimates was based on the cost to achieve desired vehicle replacement cycles and to increase the speed of service for underperforming systems; the methodology does not include the application of benefit- cost ratio floors. • All estimates in the Base Case Investment Scenario assume the federal share of highway and transit capital investment will be maintained at the 45 percent historical average. | EXHIBIT 2 – 24: BASE CASE NEEDS FORECAST | |||
(all figures in billions of 2008 dollars) | ||||
| Need to Maintain Scenairo | |||
| Total | Federal | State/Local | |
Highways | $131 | $59 | $72 | |
Transit | $42 | $19 | $23 | |
Total | $172 | $78 | $95 | |
Revenues | $76 | $32 | $44 | |
Gap | $(96) | $(46) | $(50) | |
Highways | $165 | $74 | $90 | |
Transit | $49 | $22 | $27 | |
Total | $214 | $96 | $118 | |
Revenues | $76 | $32 | $44 | |
| Gap | $(138) | $(64) | $73 |
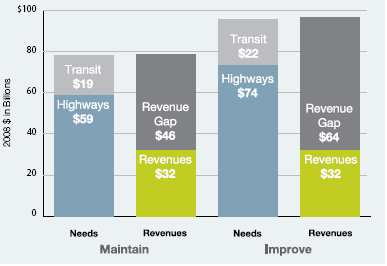
Exhibit 2-24 summarizes the results of this Base Case Investment Scenario. Total annual capital investment (from all sources) needed just to maintain current conditions and performance is estimated to average $131 Billion for highways and $42 billion for transit, in 2008 dollars. This translates into annual federal highway and transit spending requirements of $59 Billion and $19 billion, respectively, for a total of $78 billion. Using the Baseline Forecast of average annual HTF revenues of $32 billion (2008 dollars in the 2008- 35 period), the resulting annual federal investment gap for highways and transit is $46 Billion. In addition, the total average annual spending needed to go further and improve the system under the Base Case Investment Scenario is $165 billion for highways and $49 Billion for transit. The associated annual federal funding requirement is $96 Billion for highways and transit combined, leaving an annual federal revenue shortfall of $64 billion. |
|
As illustrated in Exhibit 2-25, the Baseline Forecast of average annual federal HTF revenues of $32 billion (2008 dollars) is only 41 percent of the estimated amount of federal spending needed to maintain the nation's highways and transit systems and a mere 33 percent of the estimated annual amount needed to improve conditions and performance (using a benefit-cost ratio threshold of 1.2).
EXHIBIT 2-26: SUMMARY OF LONG-TERM NEEDS AND REVENUES (2008-35 ANNUAL AVERAGE) | ||||||||
| Need to Maintain |
| Need to Improve | |||||
| Total | Federal | State/Local |
|
| Total | Federal | State/Local |
Investment Needs Highways | $131 | $59 | $72 | $165 | $74 | $90 | ||
Transit | $42 | $19 | $23 | $49 | $22 | $27 | ||
Total | $172 | $78 | $95 | $214 | $96 | $118 | ||
Baseline Revenue Forecast |
|
|
|
|
|
| ||
Revenues | $76 | $32 | $44 | $76 | $32 | $44 | ||
Gap | $(96) | $(46) | $(50) | $(138) | $(64) | $(73) | ||
MFT (¢/gal) to Close Gap | 53¢ | 25c¢ | 28¢ | 76¢ | 36¢ | 41¢ | ||
VMT Tax (¢/mile) to Close Gap | 3.2¢ | 1.5¢ | 1.7¢ | 4.6¢ | 2.1¢ | 2.4¢ | ||
Conservative Revenue Forecast |
|
|
|
|
|
| ||
Revenues | $67 | $28 | $39 | $67 | $28 | $39 | ||
Gap | $(105) | $(49) | $(56) | $(147) | $(68) | $(78) | ||
MFT (¢/gal) to Close Gap | 58¢ | 27¢ | 31¢ | 81¢ | 38¢ | 44¢ | ||
VMT Tax (¢/mile) to Close Gap | 3.5¢ | 1.6¢ | 1.9¢ | 4.9¢ | 2.3¢ | 2.60¢ | ||
Note: Sums may vary due to rounding
Exhibit 2-26 compares the Base Case investment needs with both of the revenue fore- casts. To better demonstrate the magnitude of the results, it also shows the motor fuel tax increase or, alternatively, the fee level required on a per-mile basis (referred to as a VMT fee) that would be needed at the federal and state/local levels to close the associated funding gaps. (Note that these estimated tax levels are for illustrative purposes only and are not Commission recommendations.) These conversions to cents per gallon and cents per mile are rough approximations based on the average 2007-08 motor fuel tax yields of about $1.8 billion per penny (all motor fuels) and the 2008 total vehicle miles traveled of about 3 trillion (all roads).44
The federal tax rate on all motor fuels would need to be increased by 25-27¢ per gallon to address the federal funding shortfall just to maintain the system. Funding the investment needed to improve the system would require a federal fuel tax increase of about 36-38¢ per gallon. Alternatively, a federal VMT fee (charged on all roads in addition to the existing HTF taxes) of a 1.5-1.6$ per mile would generate the federal share of the funding needed to maintain the system. And a federal VMT fee of 2.1-2.3¢ per mile would be needed to generate the additional federal funding required to improve the system.
In terms of total highway and transit investment needs (from all levels of government), maintaining the system would require a fuel tax increase of about 53-58$ per gallon or the equivalent of a VMT fee of about 3.2-3.5$ per mile. Improving the system would require a fuel tax increase of about 76-81$ per gallon or the equivalent of a VMT fee of about 4.6-4.9₵ per mile.
The long-term highway system performance that could be achieved by 2035 under the Base Case Investment Scenario (assuming sufficient revenues were provided to address the funding gap) would include the following:45
• Need to Maintain—The adjusted average user costs (these are the cost per mile of operating a vehicle and include consideration of investment impacts on costs for items such as fuel, insurance, and repairs) would remain the same in constant dollar terms, average delay would increase by 6.2 percent, pavement conditions would deteriorate by 4.8 percent, and the backlog of needed bridge investment would remain unchanged.46
• Need to Improve—The adjusted average user costs would improve slightly (1.5 per- cent reduction), average delay would decrease by 0.9 percent, pavement conditions would improve by 14.9 percent, and the backlog of needed bridge investment would be fully addressed.
Looking at near-term needs and revenues also creates a strong call for action. As summarized in Exhibit 2-27, the federal HTF current-law revenues under the Baseline Forecast total just $235 billion (in nominal dollars) over the 2010-15 period (an average of $39.1 billion per year). The federal share of cumulative needs under the Base Case Investment Scenario, meanwhile, ranges from $509 billion (to maintain the system) to $632 billion (to improve the system). The annual federal funding gap, therefore, ranges from about $43 billion to $71 billion in nominal dollars for the six-year period.