Initial deals look robust and are similar in financial structure to PFI deals
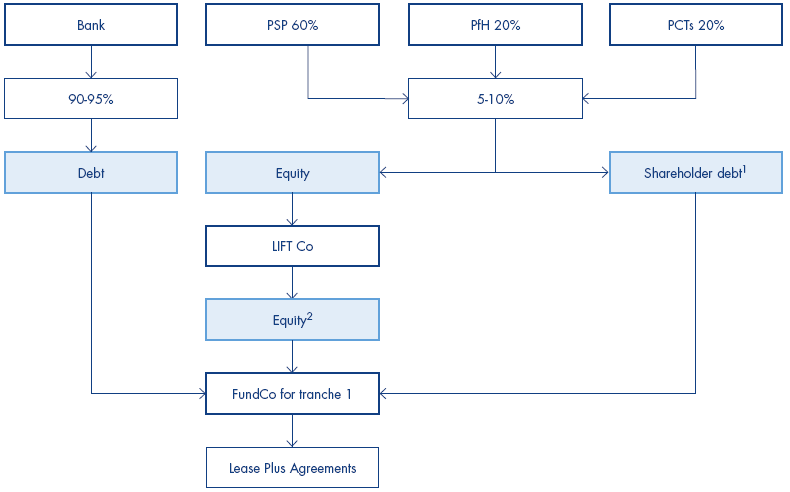
2.23 The funding structure of the LIFT model has been designed to allow relatively small capital schemes to be financed in batches, termed tranches. This allows the LIFTCo to take advantage of the economies of scale available in the capital markets. The bulk of the financing is provided through debt, with the Private Sector Partner, the Primary Care Trusts and Partnerships for Health contributing the equity, which includes some shareholder debt.
2.24 The financial models prepared by the LIFTCo and the reasonableness of its charges were examined closely by the public sector's financial advisors and the lenders. The key drivers of costs are the terms of the senior debt, the upfront costs and the return required by investors. Sensitivity analysis was carried out to show that the LIFT businesses are robust and can cope, in all but the most drastic circumstances, with variations in revenue, cost and the Retail Price Index, which is used to inflate the lease plus charge.
|
8 |
The funding structure of LIFT is heavily geared |
|
Source: Sandwell LIFTCo business case |
|
|
NOTES 1 Shareholder debt is classed as a form of equity (although it has no attached voting rights), and is used in addition to a small amount of cash equity because it allows cash to be freed up in the business once the LIFTCo is operational. |
|
2.25 The most prevalent alternative to LIFT is third party development. Direct comparison between the financing terms is not possible because of the difference in structure - whole life costs are not measured in third party developments. Moreover the financial structure and terms of third party developments vary greatly from one development to another. It is more meaningful to make comparison with similarly sized PFI projects.
2.26 For all but one project, we found that the ratio of debt to equity (gearing) and debt terms were similar to PFI. The principal differences are that in the LIFT model the residual value of the buildings after 25 years14 can be used to repay part of the loan and that security is provided for the lender through a charge over the property. Under a PFI structure the loan would be repaid before the end of the contract and security is provided to the lender through measures which:
i allow them to take over the contract if the contractor fails to fulfil its obligations; and
ii entitle them to compensation if the contract is terminated early.
2.27 Reduced repayments to the lender during the lease term compared to a PFI structure should result in more efficient use of cash flows within the LIFTCo. An increase in the perceived risk to the lender may, however, have an impact on the terms available. The costs of the debt in the early LIFT deals examined are similar to that of a typical PFI (Figure 9).
|
9 |
Terms of senior debt look similar to PFI |
|
|
||
|
|
|
Lender |
Gearing (senior debt as percentage of equity) |
Interest margin percentage above LIBOR |
Interest margin percentage above benchmark Gilt yield |
|
Barking & Havering |
GPFC |
95 |
|
1.7 |
|
|
Barnsley |
Barclays |
89.5 |
0.95-1.11 |
- |
|
|
East Lancashire |
RBS |
90 |
1.05-1.15 |
- |
|
|
East London |
Bayerische Landesbank |
90 |
1.15-1.25 |
- |
|
|
Sandwell |
HBOS |
93 |
1.00-1.05 |
- |
|
|
Ashton, Leigh & Wigan |
RBS |
88.9 |
1.05-1.15 |
- |
|
|
PFI Health centre 1 |
Not known |
89.7 |
0.90-0.95 |
- |
|
|
PFI Health centre 2 |
Not known |
90.6 |
0.90-1.15 |
- |
|
|
Source: National Audit Office derived from financial models for LIFT and similarly sized PFI health projects |
|||||
2.28 Barking and Havering LIFTCo elected to use gilt based financing rather than bank financing; gilts are government bonds. Gilt backed financing is difficult to compare to bank financing which is based on LIBOR (the London interbank offered rate), the most commonly used benchmark for interest rates. While gilt financing is competitive, the rate is only one factor determining price - margins charged and the initial cost of financing can be higher. Barking and Havering's use of gilt backed financing has had no significant impact on the cost of their deal compared to others examined.
2.29 Upfront costs for land, construction and advisory fees represent a larger proportion of the total cost of smaller LIFT projects than typical PFI deals. Inevitably fixed costs are more significant for smaller projects and combined with the newness of the LIFT initiative, this has meant that the first projects cost more than future ones are expected to. Some upfront costs not specific to any one project can be deferred to later tranches of projects to help smooth the costs over time. The long term guarantee of work from LIFT has also encouraged the private sector partner to seek lower initial returns than would otherwise have been the case.
2.30 The private sector expects a return on its investment relative to the perceived risk of the project. The blended equity Internal Rate of Return15 of LIFT projects in our case studies, varies between 14.3 and 15.9 per cent (Figure 10 overleaf). This is above the initial business planning assumption by Partnerships for Health in 2001 of 13 per cent, but is not out of line with the 12.5 to 15 per cent seen on PFI projects. Across all LIFT schemes which had finalised negotiations by the end of 2004 the range is between 12.4 and 16.2 per cent - with an average rate of 15.1 per cent. These returns, however, incorporate the residual values of the LIFT buildings which are uncertain and vary substantially across schemes - from 12 to 131 per cent of the initial construction and land costs. These differences cannot readily be explained by market variations between areas, and are more likely to be attributable to inconsistencies in the assumptions made by the District Valuers (footnote 13). Owing to these variations the actual return on the residual values is likely to be different to that assumed. There is a sharing mechanism reflecting the equity split for any eventual surplus over the residual value modelled.
|
10 |
Internal Rates of Return of LIFT are similar to PFI, but depend on the residual value of properties |
||||
|
Our case studies areas are anonymous to protect commercial sensitivities |
|
||||
|
|
IRR percentages excluding residual value |
IRR percentages including residual value |
Residual value £ million |
Residual value as percentage of land and construction costs |
|
|
LIFT case study 1 |
14.4 |
15.9 |
9.4 |
67.7 |
|
|
LIFT case study 2 |
10.6 |
14.6 |
13.5 |
131.0 |
|
|
LIFT case study 3 |
14.0 |
15.1 |
8.3 |
38.9 |
|
|
LIFT case study 4 |
Not available |
15.6 |
3.6 |
12.6 |
|
|
LIFT case study 5 |
12.2 |
14.6 |
10.0 |
96.4 |
|
|
LIFT case study 6 |
13.4 |
14.9 |
8.8 |
48.1 |
|
|
Health PFI 1 |
N/A |
15.8 |
N/A |
N/A |
|
|
Health PFI 2 |
N/A |
14.5 |
N/A |
N/A |
|
|
Source: National Audit Office derived from LIFT financial models and similarly sized PFI projects |
|||||
_______________________________________________________________________
14 Although the Strategic Partnering Agreement is for a period of 20 years, the lease on a LIFT building is usually over a 25 year period.
15 Blended IRR includes hybrid debt and equity and equates to the rate of interest that balances the present value of cash outflows from a project with the discounted cash inflow of the investment.