The use of performance measures and targets
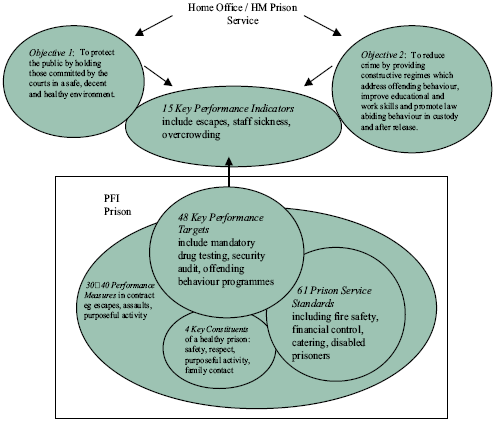
16. Public prisons are measured against 48 Key Performance Targets and have to comply with 61 Prison Service Standards (Figure 4). Her Majesty's Chief Inspector of Prisons has also set out 4 key constituents of a healthy prison. PFI and privately-managed prisons typically have to meet 30 to 40 performance measures set out in their contracts. They also have to comply with the 61 Prison Service Standards and their contracts are being amended to incorporate the relevant Key Performance Targets. Many of the targets and measures overlap and there are a number of other areas where the details of the measures are different or where different measures are used to assess performance against the same standard .16
17. There are inconsistencies between the targets set for PFI and public prisons. For example, the average target for purposeful activity in a public prison is 20.6 hours a week per prisoner, as opposed to 29.5 hours a week in PFI prisons. The Prison Service said that it had sought higher levels of performance in the early PFI contracts to get better value for money and to create a benchmark which would help to push up performance in the public sector. The PFI prisons had largely succeeded in meeting these targets, and most public prisons were also improving. But the Home Office recognised that prisons should be concentrating much more on those aspects of purposeful activity known or believed to reduce re-offending, such as education and offending behaviour programmes.17
18. The Home Office and contractors agreed that the large number of performance measures overburdened prisons, making it difficult for managers to prioritise between targets, and to monitor performance against every indicator accurately. Targets needed to be consistent if meaningful comparisons were to be drawn. Contractors were also concerned that some of the targets were input-based, for example, measuring compliance with the Prison Service Standards to prevent self-harm by prisoners rather than monitoring actual incidences of self harm. This practice stifled the potential for innovation, which was meant to be a key benefit of the PFI. In the most recent contracts for PFI prisons under construction at Ashford and Peterborough, two-thirds of the performance targets were to be measured yearly, rather than monthly, in order to reduce the reporting burden. PFI contracts were also being amended to bring them into line with current Prison Service priorities to increase educational activities in prisons, such as offending behaviour programmes, and to assist with the resettlement of prisoners prior to their release.18
Figure 4: Performance measures in a PFI prison
Source: C&AG's Report
19. The Prison Service has Service Level Agreements with five public prisons, which set out the resources to be provided and specify the required level of performance in terms similar to a contract with a PFI prison. The Home Office said that the intention was to move public prisons on to a series of such agreements so that there was a similar contractual arrangement with public prisons as with privately-managed prisons. Two of the existing Service Level Agreements were the result of a performance testing regime to identify failing prisons. A failing prison has to produce an action plan to improve, which is then implemented through a Service Level Agreement. If the plan is not acceptable, or is not fulfilled, the prison is contracted out to the private sector without an in-house bid. Two further prisons-Liverpool and Dartmoor-have now been selected to go through this process. They will face the sanction of being contracted out unless they significantly improve their performance within six months.19
20. The Prison Service is also developing a quarterly system of ranking prisons, known as the Weighted Scorecard. It scores an individual prison's performance against its targets, its previous performance and the performance of other prisons in the same category. Individual targets are weighted according to the type of prison.20
____________________________________________________________________________
16 C&AG's Report, Fig 1, paras 2.2-2.3