Economic Performance 2004-2010
GDP growth averaged 5.6 percent for the period 2004-2006, while average GNP growth was higher at 5.9 percent, boosted by transfers from overseas workers. On the demand side, private consumption (which comprises about 70% of GDP), grew an annual average of 5.4 percent. Merchandise exports grew at an average of 9.4 percent, while exports of non-factor services (which included BPOs such as back office payroll or accounting and call centers) registered an average of 20.6 percent.
Figure 2.1 Contributions to Growth (Demand)
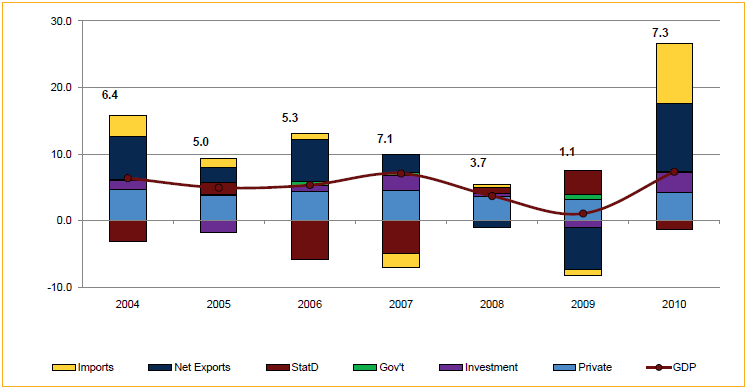
Source: NSCB
Figure 2.2 Contributions to Growth (Supply)
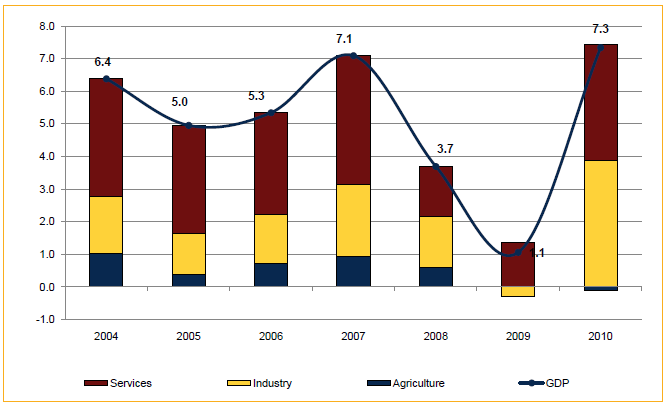
Source: NSCB
Capital formation, on the other hand, averaged 1.2 percent growth per year during the period (Table 2.7). Overall, consumption fuelled by remittances is the largest and most stable source of growth from the demand side. The contribution of net exports (including BPO), although volatile, was also positive. Investment made a small positive contribution in 2004 and 2006, but contributed negatively in 2005. The contribution of public consumption to growth has been marginal (Figure 2.1).
On the supply side, the largest contribution to growth consistently came from the services sector, followed by the industry sector. The agriculture sector, which is vulnerable to changes in weather patterns, managed to make a small positive contribution to growth during the period (Figure 2.2).
Average growth was relatively modest, owing to the economy's vulnerability to a number of domestic and external shocks. The continued US-led war on terrorism, accompanied by the escalating prices of petroleum and sluggish demand for electronics dragged down economic activities in 2005. Domestically, political factors were partly responsible for compelling the government to run under reenacted budgets. The relatively low inflation in 2002-2003 was followed by upward price pressures in 2004 due to geopolitical tensions in the Middle East and growing resource demands from China and India, all of which contributed to a surge in world oil prices.
The economy expanded at its fastest rate in three decades in 2007, with GDP growing at 7.1 percent (and GNP growing at 7.4 %). With greater fiscal space from the previous years' tax reforms, and with spending ahead of national elections, public construction rose 29.1 percent. Private construction likewise grew 13.3 percent, boosted by remittance-fuelled residential construction as well as the need for more supply of office space. Overall, capital formation grew 12.4 percent, up from the 5.1-percent growth of a year ago and the 8.8-percent contraction two years previously. Likewise, private consumption, which constitutes the largest proportion of GDP on the expenditure side, continued its stable growth at 5.9 percent, fuelled by remittances from overseas workers (Table 2.1).
Table 2.1 Philippine Key Indicators
Indicators | 2004 | 2005 | 2006 | 2007 | 2008 | 2009 | 2010 | |
6.9 | 5.4 | 5.4 | 7.5 | 6.4 | 4.0 | 7.2 | ||
6.4 | 5.0 | 5.3 | 7.1 | 3.7 | 1.1 | 7.3 | ||
Agriculture | 5.2 | 2.0 | 3.8 | 4.9 | 3.1 | 0.0 | -0.5 | |
Industry | 5.2 | 3.8 | 4.5 | 6.8 | 4.9 | -0.9 | 12.1 | |
Mining | 2.6 | 9.3 | -6.1 | 26.0 | 1.9 | 21.5 | 18.4 | |
Manufacturing | 5.8 | 5.3 | 4.2 | 3.3 | 4.2 | -4.4 | 12.3 | |
Construction | 3.4 | -5.9 | 9.6 | 21.0 | 7.6 | 9.8 | 10.5 | |
Electricity, Gas & Water | 4.2 | 2.5 | 6.4 | 6.7 | 7.3 | -2.9 | 8.5 | |
Electricity & Gas | 4.3 | 2.5 | 6.2 | 6.7 | 7.6 | -3.5 | 8.8 | |
Services | 7.7 | 7.0 | 6.5 | 8.1 | 3.1 | 2.8 | 7.1 | |
Personal Consumption | 5.9 | 4.8 | 5.5 | 5.8 | 4.7 | 4.1 | 5.3 | |
Government Consumption | 1.4 | 2.3 | 10.4 | 6.6 | 0.4 | 10.9 | 2.7 | |
Capital Formation | 7.2 | -8.8 | 5.1 | 12.4 | 2.3 | -5.7 | 17.0 | |
Fixed Capital | 1.3 | -6.6 | 3.9 | 10.9 | 2.7 | -0.4 | 17.1 | |
Construction | -0.8 | -7.3 | 7.6 | 19.5 | 4.2 | 7.4 | 12.0 | |
Public Construction | -9.3 | -18.0 | 31.4 | 29.1 | -1.3 | 22.5 | 3.7 | |
Private Construction | 4.8 | -1.1 | -3.7 | 13.3 | 8.2 | -2.8 | 19.1 | |
Durable Equipment | 3.2 | -7.1 | 1.3 | 4.5 | 1.9 | -8.2 | 25.7 | |
Changes in Stocks | -444.1 | -58.1 | 64.1 | 57.5 | -7.5 | -139.8 | -356.1 | |
Changes in Stocks | ||||||||
(% of capital formation) | 4.2 | 1.9 | 3.0 | 4.3 | 3.8 | -1.6 | -5.6 | |
Exports | 15.0 | 4.8 | 13.4 | 5.5 | -2.0 | -13.4 | 25.6 | |
Merchandise Exports | 12.9 | 4.2 | 11.3 | 4.1 | -1.7 | -16.8 | 26.0 | |
Non-Factor Services | 28.8 | 8.3 | 24.7 | 12.3 | -3.0 | 2.3 | 24.3 | |
Imports | 5.8 | 2.4 | 1.8 | -4.1 | 0.8 | -1.9 | 20.7 | |
Merchandise Imports | 6.2 | 2.1 | 1.3 | -5.6 | 0.1 | -1.8 | 20.2 | |
Non-Factor Services | -1.4 | 8.5 | 11.0 | 20.9 | 9.9 | -3.6 | 26.3 | |
Unemployment (in percent) | 11.8 | 8.7 | 8.0 | 7.3 | 7.4 | 7.5 | 7.3 | |
Underemployment (in percent) | 17.6 | 21.0 | 22.6 | 20.1 | 19.3 | 19.1 | 18.7 | |
Sources: NSCB; Labor Force Statistics Yearbook; DOLE-LFS
Note: The 2005 unemployment rate data may not be consistent due to the adoption of a new unemployment definition in the April 2005 round LFS.
On the production side, the services sector continued to be the largest contributor to growth. The industry sector, with unprecedented growth rates from mining (at 26.1%) and construction (21% ) sectors, contributed higher more to GDP growth as compared with the previous three years (Table 2.1 and Figure 2.2). Agriculture, with help from the better weather compared to the past two years, also had a higher contribution to GDP than in the past two years (Figure 2.2).
Price pressures toward the middle part of 2008 (Figure 2.10) - on account of rising world prices of grains and petroleum, as well as the global recession affecting the country through the trade channel towards the later part of the year, contributed to the slowdown of GDP growth to 3.7 percent (GNP growth was 6.4% for the year). As early as the start of 2008, it was clear the US would experience a recession and that the impact would reach the Philippines (in fact the Philippine stock index already fell 9.8% month-on-month in January 2008 and electronic exports contracted 6.5% in August 2008). It was not until close to the bottom of the crisis that policy rates were cut (on December 18, 2008) and the fiscal stimulus bared (in January 2009) This, although the inflation had been headed down since September 2008.
Monetary and fiscal stimuli came somewhat late. Overall, there was a noticeable slowdown in private consumption, and in government construction and consumption, and a contraction in exports during the year. On the production side, agriculture, industry, and services all slowed down.
The brunt of the global crisis was felt in the first half of 2009 when merchandise exports registered an average decline of 23.4 percent per quarter, caused largely by the contraction of electronics and garments exports. Furthermore, although government consumption and construction increased in the second quarter, the effects of the fiscal stimulus were blunted by the impact of two typhoons that hit the country in September-October 2009. Notwithstanding the effects of the global financial crisis, GDP in 2009 rose by 1.1 percent, a figure within the target of 0.8-1.8 percent, making the Philippines one of the few economies in the region to register positive performance amidst the recession. GNP on the other hand, grew by 4 percent, fuelled by robust inflows of overseas remittances.
Figure 2.3 Contributions to Growth (Demand)
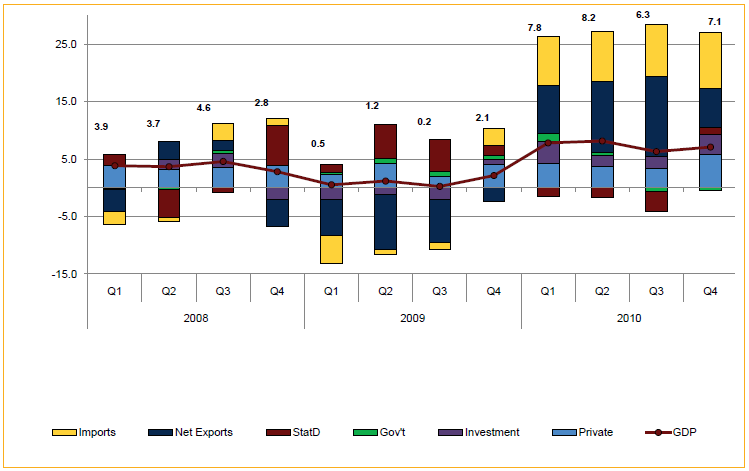
Source: NSCB
In 2010, coming from a low base and boosted by the rebound in world trade, quarterly GDP grew 7.3 percent. Remittance-driven consumption and the pick-up in investments and net exports (from significant negative contributions in 2009) boosted growth (Figure 2.3). On the supply side, the strong reversal of industrial performance (from negative contributions to growth in 2009), and the continued significant contribution of the services sector, drove the growth (Figure 2.4). Higher growth, however, was constrained by the negative impact of E1 Niño on agriculture and fisheries.
Figure 2.4 Contributions to Growth (Supply)
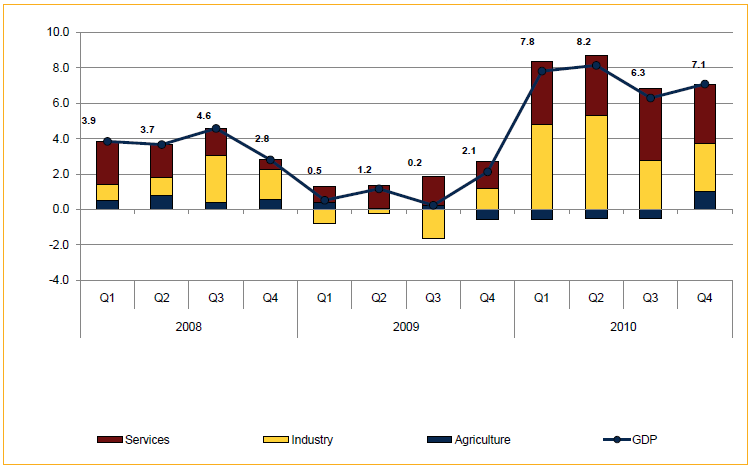
Source: NSCB
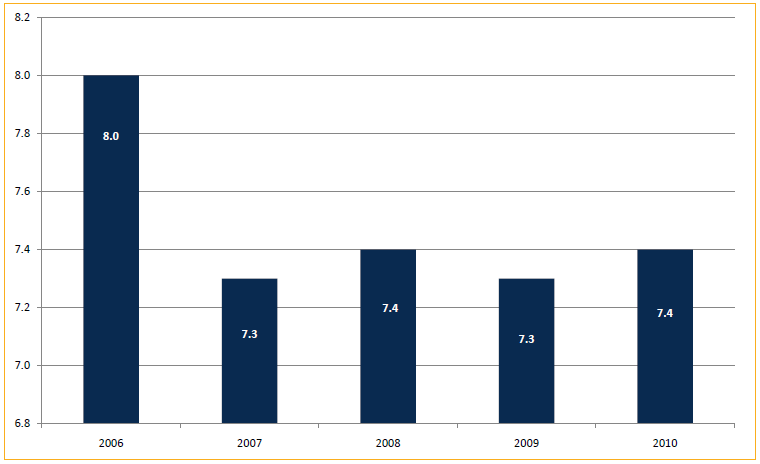
Figure 2.5 Philippines Unemployment Rate, 2006-2010 (in %)
Meanwhile, real GNP expanded by 7.9 percent as growth in net factor income from abroad eased to 10.3 percent from 31.6 percent in the same period in 2009. A significant part of the high growth in 2010 was clearly due to a recovery from a low base, implying that these growth rates cannot be expected to continue in 2011 and beyond without structural changes in the economy. Such structural changes are needed even more to achieve this Plan's goal of a 7 to 8-percent annual growth rate in GDP.