Employment and Poverty
Increased globalization and faster economic growth have provided opportunities for Filipinos entering the labor market. Using the old concept of unemployment on which the Plan targets were based, unemployment rate improved from 11.9 percent in 2004 to 11.4, 11.1 and 10.8 percent in 2005, 2006 and 2007, respectively, lower than the Plan targets. Using the new International Labor Organization (ILO)-based methodology recently adopted by the country, unemployment stood at 8 percent in 2006, 7.3 percent in 2007 and 7.4 percent in 2008 (Figure 2.5)1. Despite these improvements, however, unemployment remains high in comparison with the country's Asian neighbors (Figure 2.6) and meeting job creation targets continued to be a challenge.
Figure 2.6 Comparative Unemployment Rates in Selected Asian Economies: 2006-2010
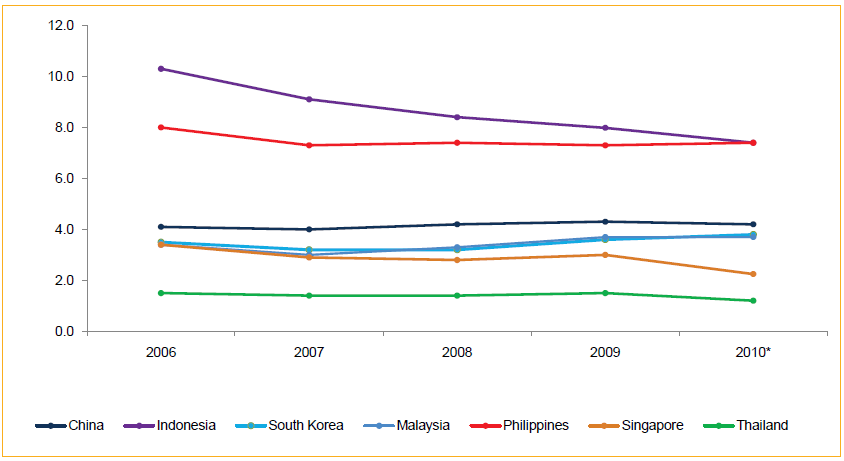
Sources: NSO, LFS; http://www.tradingeconomics.com.
* latest available data
Figure 2.7.Employment Generated, 2005-2010 (in '000)
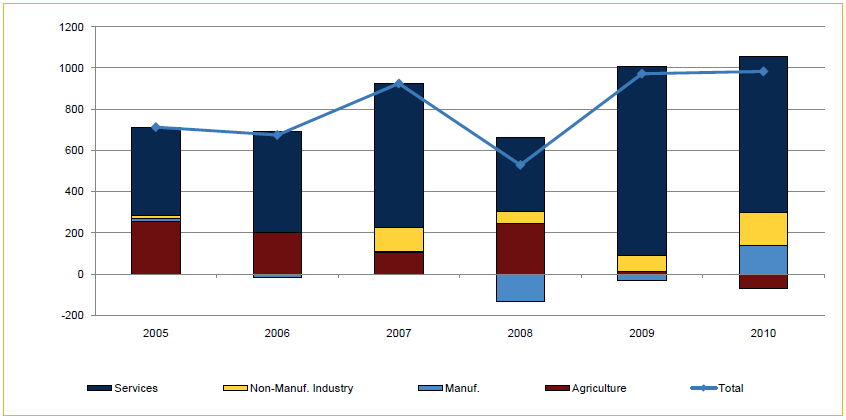
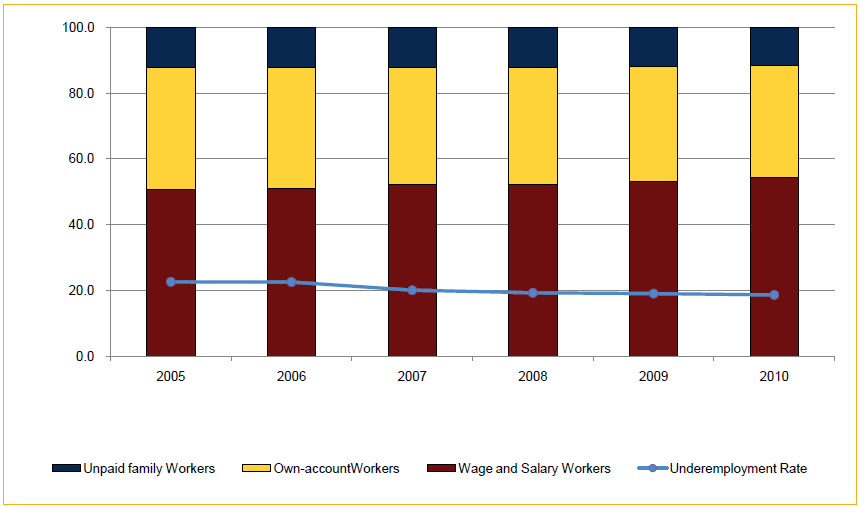
Figure 2.8 Employment by Class of Worker and Underemployment Rate, 2005-2010 (in percent)
The economic slowdown in 2008 affected the manufacturing sector and resulted in a net employment generation of only 530,000 net compared to the 771,000 yearly average for the period 2005-2007. The manufacturing sector in particular registered a negative net employment generation of about 134,000. In 2009, employment in both agriculture and manufacturing sectors remained sluggish. During that year, the services sector accounted for about 94 percent of the total 972,000 new jobs generated. (Figure 2.7).
With strong export and industrial performance in 2010, the economy showed some improvement on the labor front. In the October round of the 2010 LFS, the unemployment rate stayed at 7.1 percent, bringing the 2010 full-year average unemployment rate to 7.3 percent, lower than the 7.5 percent recorded in 2009. New jobs generated for the year were estimated at around 983,000, slightly more than in the previous year. Average underemployment in 2010 likewise improved to 18.7 percent from the previous 19.1 percent. While the LFS results indicated an improved employment situation, underemployment was still relatively high. In addition, the employment share of unpaid family workers and part-time workers stood at 11.5 percent and 35.2 percent, respectively, which suggests there is great room for improving employment conditions in the country.
Table 2.2.Official Poverty Statistics, Philippines: 2000, 2003 and 2006
Indicator |
| Year |
| |
2003 | 2006 | 2009 | ||
A. Among Families | ||||
Poverty incidence (%) | 20.0 | 21.1 | 20.9 | |
Subsistence incidence (%) | 8.2 | 8.7 | 7.9 | |
Magnitude of poor | 3,293,096 | 3,670,791 | 3,855,730 | |
Magnitude of food poor | 1,357,833 | 1,511,579 | 1,453,843 | |
B. Among population |
| |||
Poverty incidence (%) | 24.9 | 26.4 | 26.5 | |
Subsistence incidence (%) | 11.1 | 11.7 | 10.8 | |
Magnitude of poor | 19,796,954 | 22,173,190 | 23,142,481 | |
Magnitude of food poor | 8,802,918 | 9,851,362 | 9,440,397 | |
Source: NSCB
Given the high underemployment rate of about 20 percent, it is not surprising to find a relatively high percentage of own-account workers (averaging 35.7%) among Filipinos. This partly reflects the difficulty of gaining employment in the formal labor market and implies a high incidence of informal sector work. In addition, the 43.2-percent "educated unemployed" out of the total unemployed labor force is also very high, a symptom of the labor mismatch in the country and a factor contributing to the growing deployment of Filipino workers overseas, averaging about 1.1 million per year.
In the labor and employment sector, therefore, the policy challenge is to increase decent and productive employment and to enhance inclusive job-rich growth. To achieve this goal, the country can pursue supply-side strategies (such as enhancing the human resource base), as well as demand-side approaches (such as enhancing the returns to human and physical or entrepreneurial capital).
_________________________________________________________________________________________
1 The DOLE started using the ILO-based definition in the April 2005 round of the Labor Force Survey (LFS) thus making it difficult to compute the FY2005 unemployment rate.