Fiscal Sector
In 2004-2009, the government implemented reforms to place the fiscal house on a sounder footing. Major reforms to improve the revenue situation during the early part of the period included the revisions of the excise tax on alcohol and tobacco, an expansion of the scope and an increase in the rate of the value-added tax (VAT), as well as the enactment of the Lateral Attrition Law. As a result, tax effort rose from 12.5 percent in 2004 to 14.2 percent in 2008. The National Government (NG) reduced its deficit from an average of 3.9 percent of GDP in 2000-2004 to a more manageable 2.7 percent of GDP in 2005. This was further reduced to 1.1 percent in 2006 and was almost balanced in 2007 at 0.2 percent of GDP. The improved fiscal positions of the NG, the social security institutions, local governments, and the GFIs translated into a surplus in the country's consolidated public sector financial position amounting to PhP21.3 billion or 0.3 percent of GDP in 2007, from a deficit of PhP235.9 billion or 5.0 percent of GDP in 2004.
As economic activities slowed down owing to the recent global financial crisis, however, revenue collection weakened. Revenue effort dropped from 16.2 percent in 2008 to 14.6 percent in 2009, back to prereform levels. Tax effort dipped to 12.8 percent in 2009, the lowest in the ASEAN region, where it averaged 14.9 percent. In addition, several tax eroding measures were enacted in 2009 and 2010, which granted tax relief to various sectors, but depleting the revenues gained from earlier tax reforms. Revenues from taxes with specific rates also either remained flat or failed to rise in proportion with GDP because of the failure to index them. The share of excise taxes on "sin products" and petroleum barely changed during the period, from 21 percent of total revenues in 2004 to 22 percent in 2009.
Figure 2.10 Year-on-Year Inflation Rate (2004- 2010)
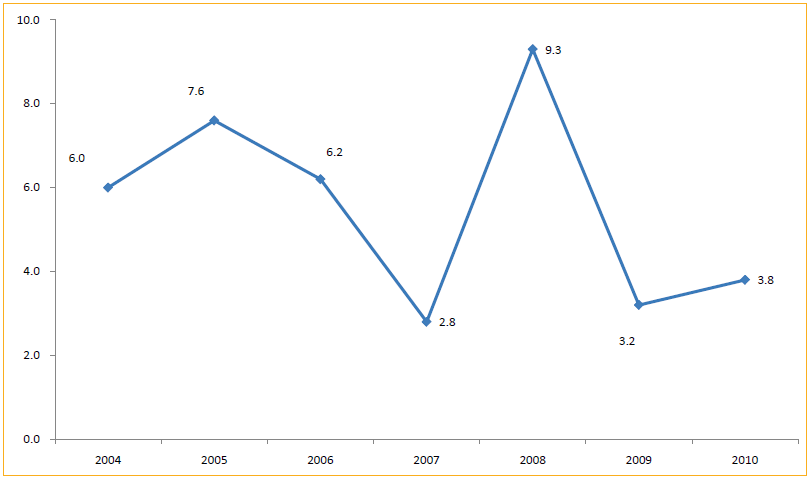
Source: Bangko Sentral ng Pilipinas (BSP)
Government's ability to raise additional revenues from nontax sources has remained weak as well. Part of the problem lies in the governance challenges faced by GOCCs in their operations. Foremost of these are the multiple and often conflicting mandates; the various levels of oversight bodies; the need to update government ownership policy; the need to improve board governance; and the need to strengthen transparency and disclosure. The exemption of some GOCCs, including GFIs, from the Salary Standardization Law (SSL) granted by Congress, has provided authority to the boards of government corporations to adjust the compensation of their officials without restraint. Certain GOCCs also have mandates that are inconsistent with prudent fiscal behavior (e.g., they are used as subsidy providers and conduits for social services which were not compensated by the NG), while others have managed to exist only on the back of government subsidies.
Table 2.4 Selected External Sector Accounts, 2004-2010* (In Billion US$)
| 2004 | 2005 | 2006 | 2007 | 2008 | 2009 | 2010 |
CURRENT ACCOUNT | 1.6 | 2.0 | 5.3 | 7.1 | 3.6 | 9.4 | 8.5 |
Goods and Services | -7.5 | -9.1 | -6.6 | -6.1 | -11.7 | -6.7 | -8.4 |
% of GDP | 1.9 | 2.0 | 4.5 | 4.9 | 2.2 | 5.8 | 4.5 |
Trade in Goods | -5.7 | -7.8 | -6.7 | -8.4 | -12.9 | -8.8 | -10.4 |
Trade in Services | -1.8 | -1.3 | 0.1 | 2.2 | 1.2 | 2.1 | 1.9 |
Income | -0.1 | -0.3 | -1.3 | -0.9 | 0.1 | -0.2 | 0.3 |
Current Transfers | 9.2 | 11.4 | 13.2 | 14.2 | 15.2 | 16.2 | 16.6 |
CAPITAL AND FINANCIAL ACCOUNT | -1.6 | 2.2 | 0.0 | 3.5 | -1.6 | -1.6 | 7.9 |
0.0 | 0.0 | 0.1 | 0.0 | 0.1 | 0.1 | 0.1 | |
Financial Account | -1.6 | 2.2 | -0.1 | 3.5 | -1.7 | -1.7 | 7.8 |
BALANCE OF PAYMENTS | -0.3 | 2.4 | 3.8 | 8.6 | 0.1 | 6.4 | 14.4 |
OFW Remittances | 8.6 | 10.7 | 12.8 | 14.4 | 16.4 | 17.9 | 19.4 |
16.2 | 18.5 | 23.0 | 33.8 | 37.6 | 44.2 | 62.4 | |
% of short-term debt based on original maturity | 321.6 | 289.2 | 458.5 | 476.4 | 536.4 | 1105.5 | 1086.2 |
% of short-term debt based on residual maturity a/ | 163.0 | 164.6 | 251.3 | 300.7 | 333.2 | 500.5 | 575.1 |
External Debt-to-GDP | 63.3 | 55.0 | 45.9 | 38.5 | 32.6 | 34.89 | 33.1 b/ |
Medium-to-long-term (% of total) | 90.8 | 88.2 | 90.7 | 87.2 | 87.0 | 92.7 | 90.4 c/ |
Short-term (% of total) | 9.2 | 11.8 | 9.3 | 12.8 | 12.9 | 7.3 | 9.6 c/ |
Source: BSP (http://www.bsp.gov.ph, updates as of March 30, 2011
a/ Refers to the adequacy of reserves to cover outstanding short-term external debt based on original maturity plus principal payments on medium-to-long-term loans of the public and private sectors falling due within the next 12 months
b/ Outstanding external debt as of September 2010
c/ January-September 2010
In addition, many fees and charges for services have not been appropriately adjusted and in some cases, have even been lowered on request of the private sector (e.g., some fees and charges which affect exporters have been lowered to accommodate them). Collections from this source have not risen in line with the costs of providing the said services.
As the revenue position weakened and given the need to for a stimulus to counter the continuing recessionary pressure, the NG deficit in 2009 reached 3.9 percent of GDP while the consolidated public sector deficit was 3.3 percent of GDP in the same year. In 2010, the NG deficit to GDP ratio dropped to 3.7 percent from 3.9 percent in 2009 while the consolidated public sector deficit improved to 1.6 percent of GDP.
Some recent developments have been encouraging, however. Total revenues in 2010 rose by 7.5 percent from the previous year. Tax revenues were up by 11.4 percent due to improved performances by the Bureau of Internal Revenue (BIR) and Bureau of Customs (BoC) which had higher collections by 9.6 and 17.7 percent, respectively. Notwithstanding these, the revenue position still remains precarious as both the BIR and the BOC fell short of their respective targets in 2010. The postponement of privatization efforts, in the expectation of better terms and conditions, has reduced nontax revenues relative to the same period in 2009. Dividends and interest income have not increased sufficiently to offset the lack of proceeds from sale of assets.
Meanwhile, disbursements grew at a slower pace than revenues, increasing by 6.7 percent from the 2009 level compared to the 7.5 percent expansion in revenues. The increase can be attributed to the higher personal services requirements (13%) due to the continuing implementation of the SSL 3, the increased provision for the CCTs and the automated national and barangay elections, the carry-over disbursements from last year's rehabilitation and reconstruction projects, and the higher provision for Internal Revenue Allotment (IRA) and interest payments.
Government spending contracted from 18.3 percent of GDP in 2004 to 17.2 percent of GDP in 2008 but has since increased to 18.5 percent of GDP as of 2009 given the government's economic resiliency program (ERP). As a share to GDP, disbursements dropped to 17.9 percent in 2010.
The year 2010 was notable for the expenditure controls brought back by government, which enabled an orderly transition - from two years of fiscal stimulus in response to the global economic crisis back to fiscal consolidation mode - as the global economic situation normalized. The tighter prioritization of expenditures with the application of the ZBB approach, and the calibration of allotment and cash releases in anticipation of revenue inflows were particularly helpful in this transition. But as the composition of expenditures and the quality of services improve, the absorptive capacity of the agencies and their capability to implement projects must be strengthened to spur economic activity and help create employment particularly in the countryside. The early approval of the Fiscal Year (FY) 2011 budget, the release of 100 percent of agency budgets in January 2011, as well as measures facilitating the procurement process were all intended to provide this spending jumpstart for the year. The closer monitoring of the rate of agency spending and absorption issues during the year should facilitate the identification of needed measures.
For the period 2004-2010, infrastructure outlays were given an increasing share of the budget, rising to 15.2 percent (2009), and remarkably higher by 4.7 percentage points than that in 2004. In 2010, infrastructure spending was 14.7 percent of total government expenditure. Similarly, the budget share of regular expenditure items necessary for more efficient operations of government increased by 2.6 percentage points from 9.4 percent in 2004 to 12 percent in 2010. Meanwhile, the budgetary requirement for interest payments was reduced from 29.2 percent of the budget in 2004 to 20.7 percent in 2010. As a result, greater fiscal space was created for capital outlays and other productive expenditures.
For 2010, infrastructure and other capital spending grew more slowly by PhP6.5 billion or 3 percent year-on-year, given the lower obligation program for infrastructure and other capital outlays in 2010 compared to 2009. The growth is largely attributed to the carry-over disbursements for rehabilitation and reconstruction activities due to typhoon Ondoy in the latter part of 2009, and for other completed projects.
Disbursements were expanded in2009 to counter the effects of the global economic slowdown and to provide additional relief, rehabilitation and reconstruction efforts prompted by the destructive calamities that hit the country. In 2010, total national government spending for the first three quarters amounted to PhP1.15 trillion, a 7.2-percent increase over that in 2009. The increase stemmed largely from spending on personal services, in compliance with mandated salary adjustments, and larger maintenance outlays. However, interest payments increased its share of the total budget from 19.6 percent to 21.2 percent after higher fiscal deficits reappeared. This higher deficit scenario, coupled with the weaker revenue effort, has constrained budgetary allocations to the economic and social sectors, which are vital for the achievement of faster and more inclusive economic growth over the medium-term.
Low levels of spending on education, health and infrastructure largely and generally reflected the low level of government public expenditure3. Low spending for social sectors caused poor outcomes in these areas and meant higher costs for the population who must spend for what government ought to have provided. NG spending on social services sector as a share of the budget declined from 28.9 percent to 27 percent in 2004 to 2007, recovering to 28.7 percent in 2009, and to 31.9 percent in 2010. Although spending on social services has gone up, the government still needs to increase its spending on priority sectors and reduce nonpriority expenditures if it is to keep pace with neighboring countries and close the gap in public spending.
Thus, generating sufficient revenues to support growth in the medium-term remains the greatest challenge for the fiscal sector. More effort in revenue collection is needed so that an expenditure program more responsive to growth can be undertaken without bloating the country's deficit and while still keeping the debt ratio at sustainable levels. Proactive debt management should also continue in order to reduce the debt service burden and to free up resources that could otherwise be channelled to more productive spending.
While the rules governing the contracting of debt and debt guarantees by agencies have recently been streamlined, some have failed to adhere to best practice and have contributed to the bloating of deficits. These instances include projects under build-transfer contracts whose fees and charges were kept unduly low for political reasons, those implemented and funded from government-to-government arrangements where accusations of overpricing are still being investigated, and automatic guarantees provided under the charters of some GOCCs.
GOCCs continue to be a large source of fiscal risk. As of end of 2008, their total liabilities (excluding those of the BSP) amounted to 36.9 percent of GDP. GOCCs are frequently directed to bear the cost of social programs that should ideally be funded out of the budget. A case in point is the NFA, which operates on a "buy-high-sell-low" policy. NFA's mandate to maintain floors for farm gate prices while keeping retail rice prices at reasonable levels virtually prevents the agency from recovering its cost. Public utilities like the Light Rail Transit Authority (LRTA) also face considerable financial constraints because user charges are maintained at levels that can only be maintained through heavy public subsidies.
Despite the power tariff increase in 2005 and the privatization of the generating assets and the off-loading of the operation and investment responsibilities for both the power plants and transmission assets to the private sector, the National Power Corporation (NPC) and the Power Sector Assets and Liabilities Management Corporation (PSALM) remain sources of fiscal risk. The full implementation of the universal levies, provided for under the Electric Power Industry Reform Act (EPIRA) will play a major role in mitigating the fiscal risks from the power sector.
_________________________________________________________________________________________
3 This is also the view of the recent Public Expenditure Review (PER) by the WB.