Investment
Total approved local and foreign investments increased from 2004 to 2008 but declined in 2009. The top two sectors, i.e. manufacturing and electricity, accounted for more than half of the total approved investment. The top four sectors (manufacturing, electricity, finance and real estate, and private services) account for 78 percent of the total (Table 3.6). In 2004, the mining industry was revitalized as the Supreme Court ruled on the constitutionality of the Philippine Mining Act of 1995.
Table 3.6: Total Approved Investments of Foreign and Filipino Nationals by Industry, In Million Pesos (2004 - 2010)
Industry | 2004 | 2005 | 2006 | 2007 | 2008 | 2009 | 2010 | |
Agriculture | 212 | 770 | 4,734 | 1,856 | 2,498 | 2,873 | 2,272 | |
Communication | - | 2,079 | 47,042 | 14,222 | 2,186 | 6 | - | |
Construction | 1,140 | 83 | 3,857 | 14,090 | 216 | 179 | 1,080 | |
8,564 | 21,659 | 45,403 | 139,078 | 131,923 | 32,296 | 189,920* | ||
Finance & R. Estate | 7,158 | 10,019 | 28,833 | 54,927 | 114,088 | 89,111 | 72,108 | |
Gas | 106,521 | 269 | - | 561 | - | 17 | - | |
Manufacturing | 54,330 | 150,161 | 151,984 | 94,677 | 75,518 | 106,300 | 215,153 | |
Mining | 1,512 | 8,294 | 16,147 | 13,776 | 48,269 | 2,019 | 8,108 | |
Private Services | 41,006 | 15,344 | 29,105 | 37,631 | 71,417 | 29,353 | 40,255 | |
Storage | 388 | 26 | 35 | 1,340 | 1,059 | - | - | |
Trade | 517 | 357 | 26,332 | 780 | 531 | 2,155 | 1,461 | |
Transportation | 467 | 22,172 | 3,530 | 10,329 | 16,516 | 3,830 | 12,248** | |
Water | - | - | - | 2,537 | - | 45,975 | - | |
Total | 221,815 | 231,233 | 357,002 | 385,804 | 464,221 | 314,114 | 542,605 | |
Source: National Statistical Coordination Board
* Data lumped for Electricity, Gas and Water
** Data lumped for Transportation, Storage and Communication
Table 3.7: BOI-PEZA Approved Investments (2009-2010)
| BOI | PEZA | Total | ||||||
| 2010 | 2009 | % Change | 2010 1/ | 2009/2 | % Change | 2010 | 2009 | % Change |
Project Cost (P) | 302,100 | 124,171 | 143.29 | 204,395 | 175,365 | 16.55 | 506,494 | 299,537 | 69.09 |
Foreign (P) | 22,329 | 10,397 | 114.76 | 142,167 | 103,421 | 37.46 | 164,496 | 113,818 | 44.53 |
Local (P) | 279,771 | 113,775 | 145.90 | 62,227 | 71,944 | (13.51) | 341,998 | 185,719 | 84.15 |
No. of Projects | 246 | 248 | (0.81) | 518 | 502 | 3.19 | 764 | 750 | 1.87 |
Employment | 36,751 | 95,372 | (61.47) | 84,340 | 79,435 | 6.17 | 121,091 | 174,807 | (30.73) |
Source:
Board of Investments and Philippine Economic Zone Authority
1/ Locator investments - PhP 176.753billion; Developers - PhP 27.641 billion
2/ Locator investments - PhP 140.987billion; Developers - PhP 34.378billion
A review of share by sector/industry shows no trend in increase or decrease of particular sector, with approved investments in most sectors fluctuating annually.
From 2004 to 2009, direct investments grew by 7.8 percent5, although 2009 saw investment flows decreasing by 32.3 percent, reflecting the effects of the global crisis, there were hopeful signs of a rebound. In 2010, investment commitments from both foreigners and Filipinos increased to PhP542.6 billion compared to PhP314.1 billion in 2009. More than 60 percent of investments approved during the period came from Filipino investors with PhP346.5 billion worth of pledges.
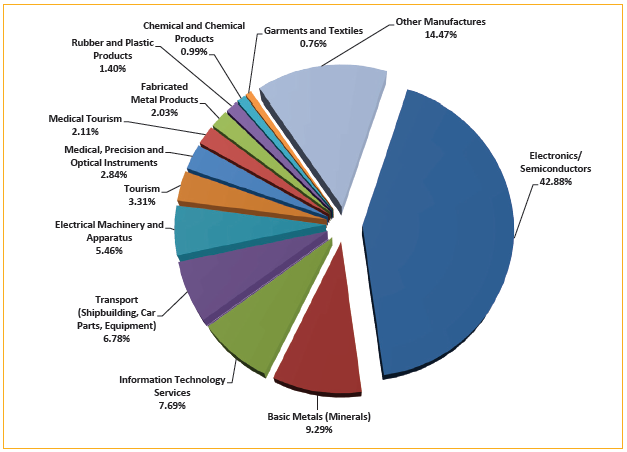
Figure 3.2. Investment by Industry Sector in PEZA Economic Zones (1995-2010)
Source: Philippine Economic Zone Authority
Table 3.8: Total Approved Foreign Direct Investments by Country of Investor From 2004 - 2010, In Million Pesos
Country | 2004 | 2005 | 2006 | 2007 | 2008 | 2009 | 2010 |
Japan | 26,596 | 27,539 | 20,066 | 38,587 | 16,116 | 70,737 | 58,333 |
USA | 27,108 | 14,913 | 8,199 | 36,089 | 19,721 | 12,947 | 13.159 |
Korea | 3,260 | 10,828 | 4,327 | 12,076 | 39,954 | 9,624 | 31,182 |
Netherlands | 1,473 | 19,208 | 188 | 14,401 | 45,354 | 2,070 | 36,784 |
Singapore | 1,524 | 889 | 396 | 44,246 | 6,565 | 3,468 | 7,283 |
UK | 1,683 | 195 | 5,887 | 10,182 | 25,272 | 3,439 | 1,065 |
China (PROC) | 127 | 195 | 7,935 | 1,822 | 2,307 | 2,392 | 5,657 |
Br. Virgin Islands | 208 | 658 | 450 | 670 | 2,111 | 1,176 | 7,654 |
Others | 111,916 | 21,382 | 18,432 | 56,010 | 25,281 | 15,963 | 48,098 |
Total | 173,895 | 95,807 | 65,880 | 214,083 | 182,681 | 121,816 | 196,069 |
Source of basic data: National Statistical Coordination Board
Of the PhP542.6 billion worth of investment pledges of both foreigners and Filipinos in 2010, 39.7 percent or PhP215.2 billion are intended for projects in manufacturing. Electricity, gas and water garnered 35.0 percent share or PhP189.9 billion, and finance and real estate at 13.3 percent or PhP72.1 billion. These industries have been consistent recipients of investment commitments from foreign and Filipino investors. Potential investments in manufacturing as well as in electricity, gas and water increased significantly compared to finance and real estate, which dropped to PhP72.1 billion from PhP89.1 billion.
Total BOI-PEZA-approved investments for 2010 amounted to PhP506.5 billion, a 69 percent surge over approvals in 2009 (Table 3.7). This was brought about by resurgent investor confidence, which reached an all time high in the second quarter of 2010. These approved investments generated 121,091 jobs.
By country of origin, the US and Japan have been the two top sources of FDI in the Philippines. In recent years investments from the Netherlands, the United Kingdom and South Korea have also increased (Table 3.8).
Investments with the Philippine Economic Zone Authority (PEZA) in 2009 posted an increase of 13.3 percent over the previous year despite the global financial crisis. Direct employment in PEZA zones also grew slightly (by 0.44 percent) notwithstanding layoffs in many business establishments in the country and worldwide during the same period.
From 1995 to 2010, investments in enterprises located inside PEZA-registered economic zones came mostly from the electronics/semiconductor industry. Locators from the electronics/semiconductor sector contributed 42.88 percent of total investments in the ecozones. Following this was the basic metal/mineral industry (9.29%); information technology services (7.69%); transport (shipbuilding, car part, equipment) (6.78%) and electrical machinery and apparatus (5.46%). These comprise the top five sectors garnering the largest number of investments over the past 15 years of PEZA's existence (Figure 3.2).
Table 3.9: PEZA Operating Economic Zones (2004 - 2010)
Operating Economic Zones | 2004 | 2005 | 2006 | 2007 | 2008 | 2009 | 2010 |
Manufacturing | 53 | 51 | 53 | 60 | 62 | 63 | 64 |
16 | 28 | 37 | 88 | 112 | 127 | 148 | |
Tourism |
| 1 | 2 | 5 | 7 | 9 | 12 |
Medical Tourism Park |
|
|
| 1 | 1 | 1 | 1 |
Medical Tourism Center |
|
|
|
| 1 | 1 | 1 |
Agro-Industrial EZ |
|
|
|
|
| 6 | 13 |
Total Operating | 69 | 80 | 92 | 154 | 183 | 207 | 239 |
% of Growth Over Previous Year |
| 16% | 15% | 67% | 19% | 13% | 15% |
Source: Philippine Economic Zone Authority
The majority of PEZA-registered enterprises are owned by foreign nationals. The Japanese, owning 25.97 percent of total PEZA-registered locator enterprises in 2010, top the list of foreign owners. These are followed, in order, by Koreans (10.62%), Americans (10.12%), Singaporeans (3.96%), British (2.99%), Taiwanese (2.23%), Dutch (2.15%), Chinese (1.77%), Australian (1.69%), Malaysian (1.39%), German (1.35%), and various other nationalities (7%).
In 2010, the economic zones operating under PEZA management totaled 239 (Table 3.9). In the next six years, initiatives will be pursued to enhance and increase the number of economic zones following the observed growth patterns. Efforts shall include exploration of new areas such as agro-industrial and tourism zones, opening to new markets such as the Middle East, Germany, Australia and New Zealand, and strengthening priority markets of Japan, USA and Korea.
Since ecozone applications are private sector initiated and market-driven, prospective locators may locate in certain areas for as long as they meet the criteria stipulated in Section 6 (Criteria for the Establishment of Other Ecozones) of The Special Economic Zone Act of 1995.
Opportunities for investments also are attributed to sound policies and reforms to attract investors. Policies for investments such as exhibiting sound incentives to distinct industry have been unstable.
Reforms are required to appropriately offer incentives to investments in sectors that will have high impact on employment as well as influx of reserves in the country. However, it is also important that sectors are reviewed and monitored to determine industry sectors that should be prioritized in providing incentives. Likewise, reforms are necessary to foster public and private partnerships in boosting investment areas, programs and projects.
_________________________________________________________________________________________
5 Based on compounded annual growth rate