Employment
Rise in employment in industry and services
In 2008 the number of employed persons increased from about 31.6 million in 2004 to around 34 million in 20086. This meant almost three million persons joined the Philippine labor force over a period of four years.
The agricultural sector continues to play an important role in employment and in jobs creation as it has employed about 10.6 million Filipinos in 2008. In addition, the fishing sector employed about 1.42 million persons in 2008. Most Filipino workers therefore, are still in the agriculture and fishing sectors while the rest are in non-agricultural sectors such as industry and services.
Nonetheless, workers and employees in the industry and services sectors combined outnumber agricultural workers and comprise more than half of the employed from 2004 to 2008. The economic role of nonagricultural workers, especially those in the services sector, is therefore crucial, especially in the era of the knowledge- and skills-based economy, the most evident local manifestation is the booming outsourcing industry.
As of 2010, a total of 38.9 million were reported to be in the labor force from among the 60.7 million population over 15 years of age. Of the three sectors (i.e. Agriculture, Industry and Services), Services accounts for the biggest share of total employment (Table 3.11). The current Plan calls for total employment to grow by six million by 2016.
The MSME contribution to employment in 2008 totaled 3.4 million. Ranked by subsector, wholesale and retail trade contributed the bulk of employment at 35.1 percent, followed by manufacturing with 18.7 percent and hotels and restaurants with 12.46 percent (Figure 3.3).
Among microenterprises, wholesale and retail trade contributed 47 percent of total employment, followed by manufacturing with a 15 percent share, and hotels and restaurants with 13 percent. This is the same employment pattern for small enterprises with wholesale and retail trade accounting for 26 percent, followed by manufacturing and hotels and restaurants with contributions of 19 percent and 13 percent, respectively. The pattern is somewhat different for medium enterprises, where manufacturing makes the biggest contribution (31%) followed by wholesale and retail trade (14%) and real estate, renting and business activities (12%). This pattern is repeated for large enterprises, with manufacturing contributing almost 37 percent of employment, followed by real estate, renting and business activities (21%) and financial intermediation (10%.)
Table 3.11: Employment per Major Industry Group
| Major Industry Group | 2008 | 2009 | 2010 | ||||||||
| Ave | Jan | Apr | Jul | Oct | Ave | Jan | Apr | Jul p | Oct p | ||
| ALL INDUSTRIES | 34,089 | 35,061 | 34,262 | 34,997 | 35,508 | 35,478 | 36,047 | 36,000 | 35,413 | 36,285 | 36,489 |
| Agriculture | 12,030 | 12,043 | 11,846 | 12,313 | 11,940 | 12,072 | 11,974 | 11,804 | 11,512 | 12,317 | 12,261 |
| Agriculture, Hunting and Forestry | 10,604 | 10,582 | 10,446 | 10,841 | 10,476 | 10,563 | 10,505 | 10,346 | 10,073 | 10,835 | 10,765 |
| Fishing | 1,426 | 1,461 | 1,400 | 1,472 | 1,464 | 1,509 | 1,469 | 1,458 | 1,439 | 1,482 | 1,496 |
| Industry | 5,048 | 5,093 | 4,856 | 5,088 | 5,273 | 5,154 | 5,394 | 5,323 | 5,487 | 5,391 | 5,373 |
| Mining and Quarrying | 158 | 166 | 152 | 166 | 177 | 169 | 199 | 193 | 212 | 193 | 197 |
| Manufacturing | 2,926 | 2,894 | 2,849 | 2,841 | 2,947 | 2,937 | 3,031 | 3,009 | 3,063 | 2,995 | 3,057 |
| Electricity, Gas and Water Supply | 130 | 142 | 134 | 130 | 145 | 160 | 150 | 157 | 137 | 140 | 164 |
| Construction | 1,834 | 1,891 | 1,721 | 1,951 | 2,004 | 1,888 | 2,014 | 1,964 | 2,075 | 2,062 | 1,955 |
| Services | 17,011 | 17,925 | 17,560 | 17,595 | 18,294 | 18,250 | 18,680 | 18,874 | 18,414 | 18,577 | 18,855 |
| Wholesale & Retail Trade, Repair of Motor Vehicles, Motorcycles and Personal and Household Goods | 6,446 | 6,736 | 6,635 | 6,681 | 6,725 | 6,901 | 7,040 | 7,063 | 6,885 | 7,050 | 7,161 |
| Hotels and Restaurants | 953 | 1,010 | 988 | 976 | 1,064 | 1,012 | 1,063 | 1,104 | 991 | 1,034 | 1,121 |
| Transport, Storage and Communications | 2,590 | 2,679 | 2,660 | 2,628 | 2,694 | 2,735 | 2,721 | 2,736 | 2,741 | 2,697 | 2,709 |
| Financial Intermediation | 368 | 369 | 337 | 389 | 376 | 375 | 399 | 384 | 383 | 419 | 411 |
| Real Estate, Renting and Business Activities | 953 | 1,064 | 1,044 | 1,023 | 1,090 | 1,100 | 1,147 | 1,120 | 1,061 | 1,164 | 1,243 |
| Public Administration & Defense, Compulsary Social Security | 1,676 | 1,749 | 1,659 | 1,794 | 1,772 | 1,771 | 1,846 | 1,823 | 1,959 | 1,831 | 1,771 |
| Education | 1,071 | 1,138 | 1,157 | 1,068 | 1,157 | 1,168 | 1,175 | 1,146 | 1,156 | 1,234 | 1,165 |
| Health and Social Work | 392 | 421 | 435 | 408 | 428 | 412 | 450 | 432 | 447 | 456 | 464 |
| Other Community, Social and Personal Service Activities | 833 | 877 | 857 | 907 | 876 | 868 | 913 | 950 | 984 | 862 | 855 |
| Private Households with Employed Persons | 1,729 | 1,880 | 1,785 | 1,718 | 2,110 | 1,908 | 1,925 | 2,114 | 1,804 | 1,829 | 1,954 |
| Extra-Territorial Organizations & Bodies | 1 | 2 | 3 | 3 | 2 | - | 2 | 2 | 3 | 1 | 1 |
Notes:
1. Details may not add up to totals due to rounding.
2. Based on past week reference period.
3. Industry classification is based on the 1994 Philippine Standard Industrial Classification
p Preliminary
Source of basic data: National Statistics Office, Labor Force Survey
A survey by the Bureau of Labor and Employment Statistics reports that employers have difficulty filling up vacancies because of a shortage of applicants with the right job competencies and qualifications, although two million Filipinos were unemployed. The 2006 National Manpower Summit emphasized that unemployment in the country arose mainly from a mismatch between skills needed for available jobs and skills possessed by job-seekers; and a geographic mismatch between locations of job opening and job seekers. While shortages of skills are evident in certain occupations and areas in the country, oversupply of other skills are likewise observed.
To date, there are reported shortages in medical and health services, as Filipino nurses are in high demand abroad. High turnover rates and low hiring rates meanwhile continue to worry stakeholders in the BPO industry. On the other hand, an oversupply of skills in certain occupations is also reported. For instance, the educational system continues to produce large numbers of liberal-arts graduates for whom the demand is either not encouraging or still to be identified.
Figure 3.3: MSME 2008 Employment Share by Sector
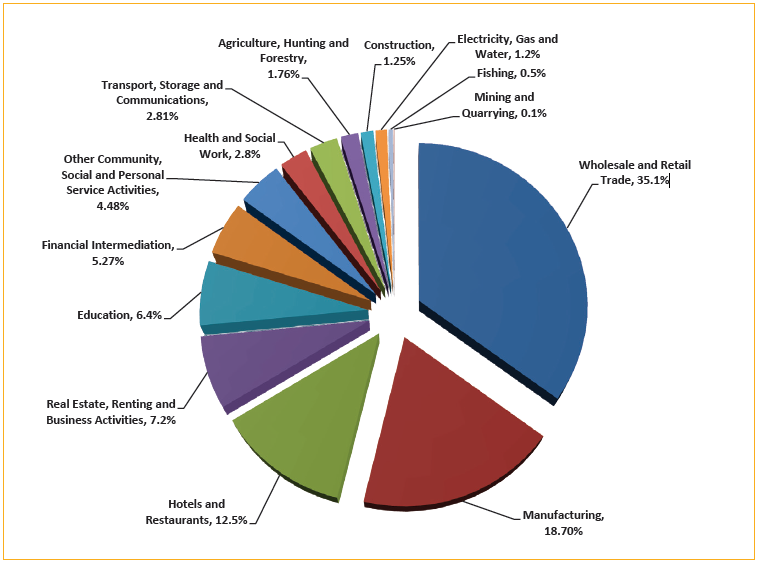
Source: National Statistics Office
In addition, the country's low labor productivity due to mismatched or deficient skills relative to available jobs contributes to the low productivity in output of goods and services. This also affects compensation, since some company owners are unable to raise wages and salaries owing to missed revenue opportunities which in turn are caused by low production.
Reports during the consultations for the DOLE Project Jobsfit 2020 also noted a concentration of hard-to-fill occupations in the high-end categories, such as accountants and engineering professionals. Hard-to-fill vacancies were also noted for associate professionals and clerks.
This "square pegs-round holes" phenomenon, which has affected efficiency in the labor market, may be aggravated by the fast-changing demand for skills in the global labor market.
_________________________________________________________________________________________
6 2009 Yearbook of Labor Statistics.