Assessment, Issues, Challenges
Limited access 9
Most assessments show a limited overall coverage and low level of access to safe drinking water in many areas of the country. Among others, the World Bank (2005) noted a decline in access to improved water services from the late 1990s to 2002. The 2010 Report of the WHO/UNICEF Joint Monitoring Program on the MDGs10 observed minimal increases in coverage over the past two decades, particularly in urban areas. Moreover, there is a wide disparity in coverage between urban and rural areas (see Table 5.1). Regional data further reveals a broad inequity of access even among rural areas.
The Philippines Progress Report on the MDG 2010, on the other hand, suggests that the sector is on track to attain its MDG commitment (Figure 5.1). Nonetheless, achieving 100-percent coverage remains a challenge, since 15.73 million people continue to have no access to a safe water supply.
Data on the number of service providers remain inconsistent and have not been consolidated. Notwithstanding this, Table 5.2 shows the approximate proportion of the population with access to clean drinking water within the scope of certain groups of formal service providers. Approximately 20 percent continue to rely on informal access, which are generally not considered sustainable.
Table 5.1. Estimated Coverage of Access to Water
Year | URBAN AREAS (in %) | RURAL AREAS (in %) | |||
Total | Household Connections | Total | Household Connections | ||
1990 | 93 | 40 | 76 | 8 | |
1995 | 93 | 46 | 79 | 13 | |
2000 | 93 | 51 | 82 | 18 | |
2005 | 93 | 57 | 85 | 23 | |
2008 | 93 | 60 | 87 | 25 | |
Source: WHO/UNICEF JMP 2010 Report
Figure 5.1. Percentage Access to Safe Water
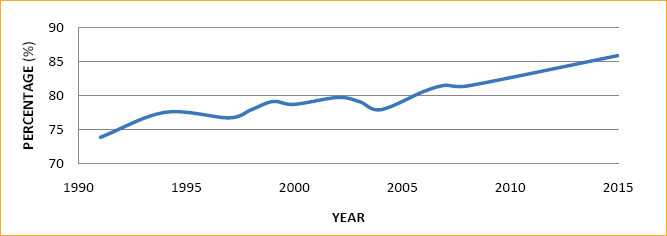
Source: Philippines Progress Report on the Millennium Development Goals 2010
Table 5.2. Levels of Access to Safe Drinking Water
Access to FORMAL levels of service/a | Informal Access | ||||
Level 3: 45% |
| Level 2: 10% | Level 1: 25% | Self-provision through private wells, tanked or vended water supply or piped supply provided by SSIPs | |
WDs: 20% | P O s: 5% | 35% | |||
Note:
WDs: Water Districts
PO: Private Operators (e.g., concessionaires, private developers, etc.)
CBOs: Community-based Organizations (e.g., rural or barangay water service associations, cooperatives, etc.)
SSIPs: Small Scale Independent Providers
Source: WB Report, Philippines: Meeting Infrastructure Challenges, 2005, as quoted in the NEDA Philippine Water Supply Sector Roadmap, 2010
(Footnotes)
/a As defined in NEDA Board Resolution No. 12, Series of 1995: Level I (point source) - a protected well or developed spring system without a distribution system; Level II (communal faucet system or standpost) - a system composed of a source, reservoir, distribution system and communal faucets; and Level III (waterworks system or individual household connections) - a system composed of a source, reservoir, piped distribution system and household taps
Low investment levels and lack of financing for waterless areas
Investment levels are too low to meet the growing demand for water. Among the key constraints to expanded coverage and improved quality of service are the low tariffs which hinder cost recovery and prevent the accumulation of funds for new capital expenditures. While cost recovery has been identified as a principle of regulatory policy, there has been minimal progress to achieve it. Regulatory oversight has been highly fragmented, as exemplified by the existence of: (a) three entities-NWRB, LWUA and the different LGUs-that exercise primary regulatory functions; and (b) specialized regulatory bodies such as the Subic Bay Regulatory Board and Metropolitan Waterworks and Sewerage System-Regulatory Office (MWSS-RO). These institutions have different regulatory practices, processes, tariff-setting methodologies, and more importantly, overlapping functions or jurisdictions, resulting in variances in regulatory rules and enforcement across types of service providers. The lack of a single independent regulator for the water supply sector is a major reason for the absence of a clear regulatory framework with a credible and effective tariff methodology that is shielded from political intrusion, founded on accountability to consumers, and conducive to new investments to meet supply needs.
The program for waterless areas, which aims to provide water to 212 waterless barangays in Metro Manila and 432 waterless municipalities outside Metro Manila, has been allotted an annual budget of PhP1.5 billion. Because the administration of the funds was largely discretionary, 40 percent (212 municipalities) of 432 municipalities identified as beneficiaries of the fund were not even part of the original list.
Moreover, there is no clear policy framework to guide the financing of water supply programs and projects. Currently, financing originates from a variety of sources. National government financing is primarily administered through LWUA and MWSS or onlent through GFIs or the Municipal Development Fund Office (MDFO). Additionally, congressional funds for water supply projects are significant but uncoordinated and largely allocated to areas based on political considerations. Local government funding, on the other hand, has mostly been for operation and maintenance rather than capital expenditures. (World Bank 2005) Private-sector financing has been skewed towards Metro Manila, and, there has been limited private investment by water utilities and private households outside Metro Manila.
Lack of new water sources to meet existing and future demand in growth centers
The rapid increase in population resulting in the pollution of water systems and, in some areas, the exhaustion of groundwater reserves has quickly widened the gap between supply and demand for potable water, especially in tourism destinations, industrial areas and highly urbanized cities. Furthermore, extended dry seasons as a result of climate change are expected to exacerbate the demand for water. New water sources must be identified and developed to address this gap. The existence of financially viable areas for water supply means there is a good opportunity for the private sector to be engaged in source development.
________________________________________________________________________________________________
9 Reasonable Access - availability of at least 20 liters per day from a source within 1 kilometer of the dwelling (World Bank and UNICEF Joint Measurement Programme: www.wssinfo.org, accessed 22 November 2010)
10 The WHO/UNICEF Joint Monitoring Programme (JMP) for Water Supply and Sanitation is the official United Nations mechanism tasked with monitoring progress towards MDG-7 or halving the proportion of the population without access to water and basic sanitation.