1. Gaps in communications and information access/services, particularly, low coverage, penetration, and uptake of Internet and broadband
Despite growth in the ICT sector, the pattern of this growth, particularly the rate of catch-up, differs among the types of ICT services and their deployment across the regions. Among the available ICT services in the market, CMTS has the biggest advantage in terms of coverage and subscription, while Internet, especially broadband access, still lags.
The current infrastructure (backbone network) already connects most of the Philippines, but there are still gaps in connecting a significant number of end users, such as communities, households, schools, as well as local units and agencies of government, especially in the rural areas. This suggests a wide disparity in the availability and level of ICT infrastructure and services, especially between major urban centers and rural areas. Profitability issues and situations in sparsely populated rural areas, including lack of important infrastructure support (e.g., availability of electricity and transport system) and possible risks of lower demand and subscriber base, preclude the entry of private operators.
It is recognized that the task of developing the country's ICT infrastructure primarily resides with the private sector. If broadband connectivity, however, is fully left to market mechanisms, it likely will be deployed by the private sector to urban centers only, with very limited roll-out in rural areas. Moreover, there is also a need to ensure that the benefits of the Internet and related technologies, including participation in ICT investment and opportunities, is made available into all segments of the population, including those who are disadvantaged due to education, age, gender, disabilities, ethnicity, income and those who live in remote regions.
Table 5.7. Internet Connection in Public High Schools per Region: 2009
| REGION | TOTAL NO. OF PUBLIC HS | CONNECTED | WITHOUT CONNECTION | |||
| No. of HS | % Connected | w/in Telco area | Out of Telco area | % Unconnected | ||
| National | 6650 | 136 | 29.1 | 1150 | 3564 | 70.9 |
| 220 | 157 | 71.4 | 63 | 0 | 28.6 | |
| 243 | 7 | 2.9 | 46 | 190 | 97.1 | |
| I | 461 | 81 | 17.6 | 101 | 279 | 82.4 |
| II | 350 | 26 | 7.4 | 33 | 291 | 92.6 |
| III | 502 | 115 | 22.9 | 81 | 306 | 77.1 |
| IV-A | 578 | 214 | 37 | 118 | 246 | 63 |
| IV-B | 340 | 34 | 10 | 39 | 267 | 90 |
| V | 582 | 38 | 6.5 | 78 | 466 | 93.5 |
| VI | 603 | 139 | 23.1 | 185 | 279 | 76.9 |
| VII | 610 | 298 | 48.9 | 107 | 205 | 51.1 |
| VIII | 397 | 70 | 17.6 | 88 | 239 | 82.4 |
| IX | 330 | 144 | 43.6 | 21 | 165 | 56.4 |
| X | 278 | 154 | 55.4 | 55 | 69 | 44.6 |
| XI | 279 | 61 | 21.9 | 76 | 142 | 78.1 |
| XII | 332 | 233 | 70.2 | 16 | 83 | 29.8 |
| XIII | 297 | 64 | 21.5 | 34 | 199 | 78.5 |
| 248 | 101 | 40.7 | 9 | 138 | 59.3 | |
Source: Japan International Cooperation Agency (JICA) Study
Figure 5.8. State of Web Presence among NGAs/a as of September 2010
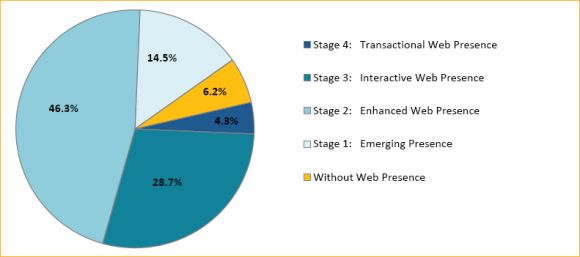
Source: National Computer Center (NCC)
/a Stages of Web presence based on the United Nations and the American Society of Public Administration (UN-ASPA) standards
The growth in the country's population has also driven an increasing demand for high-speed bandwidth and high-capacity application.